Is the U.S. trade deficit reaching new heights or stabilizing in 2024?
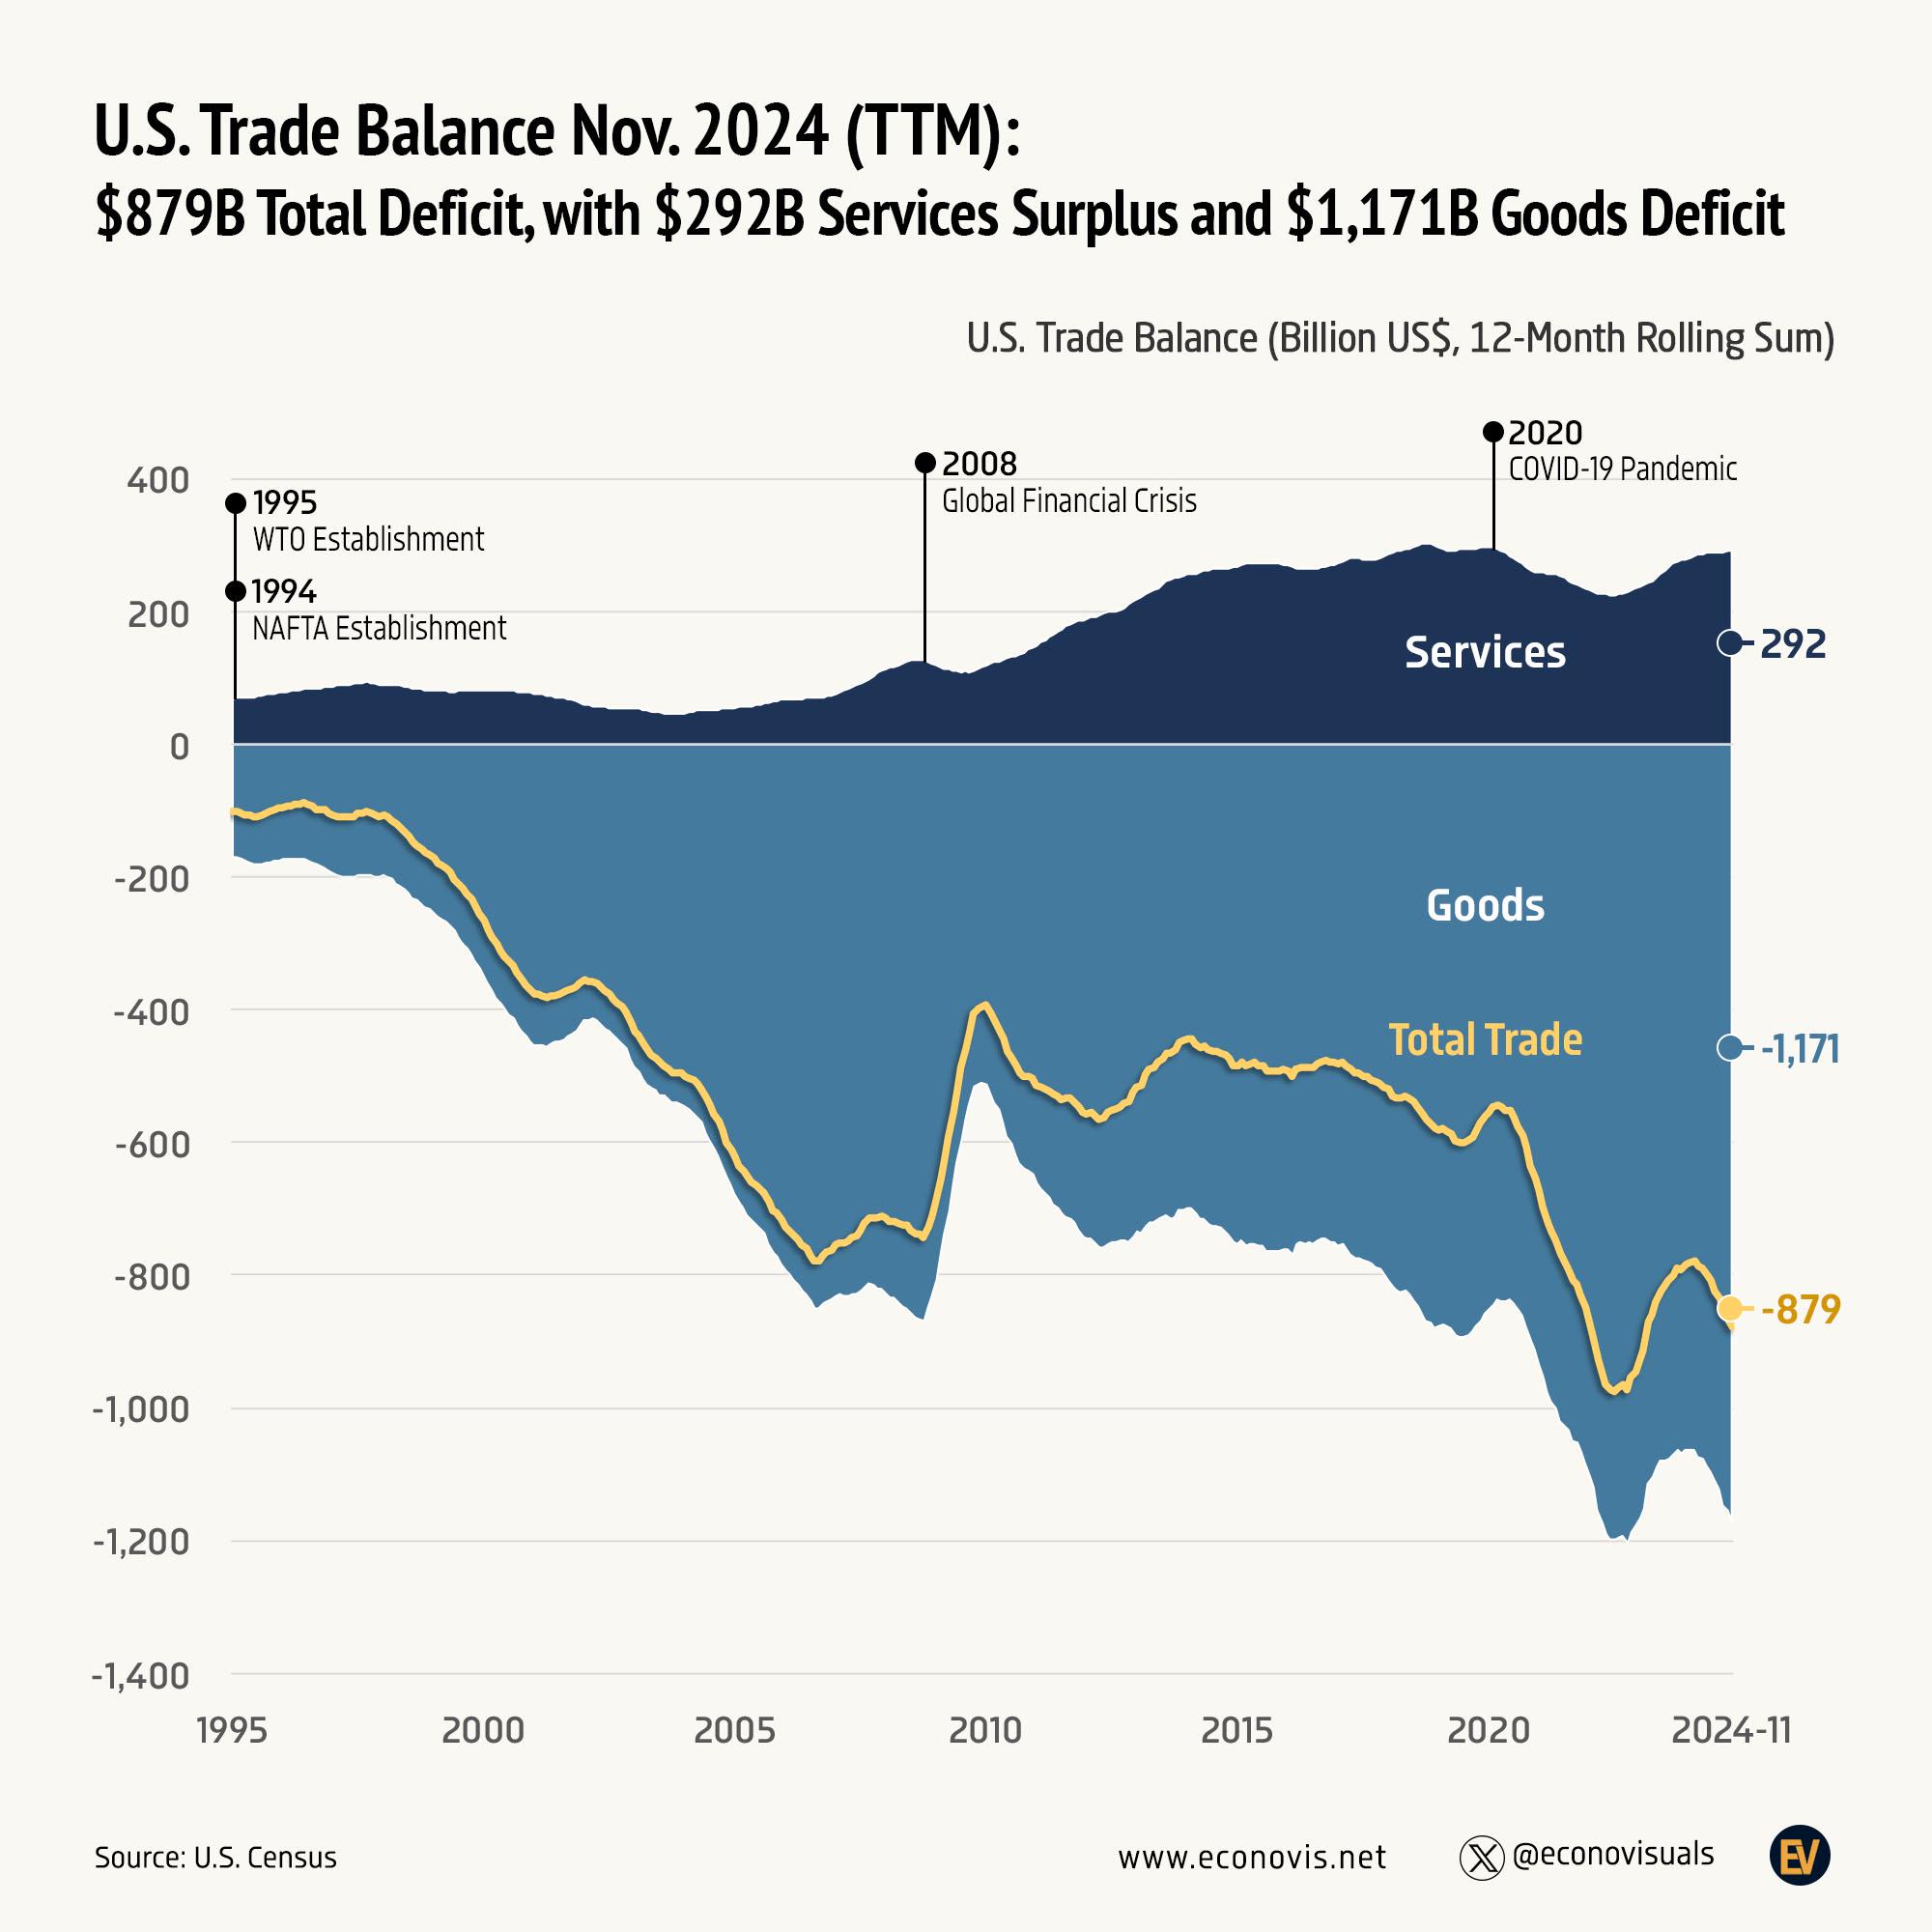
As of November 2024, the U.S. trade balance illustrates a staggering deficit of $879 billion, with a striking contrast between a goods deficit of $1,171 billion and a services surplus of $292 billion.
These figures not only highlight the complex dynamics of international trade but also set the stage for a detailed analysis of economic influences and historical trends.
This post will delve into the key insights of the U.S. trade balance statistics for 2024, dissecting the data to understand its economic implications and provide a comprehensive outlook.
The U.S. trade deficit, which has averaged a deficit of $25,672.77 million from 1955 to 2024, reflects enduring trends and shapes the broader economic narrative.
Overview of U.S. Trade Balance Statistics 2024
The U.S. trade balance for 2024 reveals a total deficit of $879 billion, with a distinct division between goods and services. The goods deficit stands at a significant $1,171 billion, indicating the continued challenge in balancing imports and exports of tangible products. In contrast, the services sector provides a bright spot with a surplus of $292 billion. This surplus in services highlights the U.S.'s strength in sectors such as finance, technology, and education, which partially offsets the substantial goods deficit.
Historically, the U.S. trade balance has consistently shown a deficit. From 1955 to 2024, the average goods trade deficit was approximately $25,672.77 million. This long-standing trend underscores the structural nature of the U.S. trade imbalance, influenced by factors like consumer demand for imported goods and global supply chain dynamics. Notably, these historical trends offer context for the current figures, illustrating a persistent challenge in achieving a balanced trade portfolio.
The most recent data update, as of January 2025, is crucial for economic analysis and policy formulation. Accurate and current trade balance statistics help economists and policymakers assess the health of the U.S. economy and its competitiveness on a global scale. Such data is instrumental in identifying areas for improvement, crafting responsive trade policies, and understanding the broader economic implications of trade imbalances.
| Year | Goods Deficit (in billion $) | Services Surplus (in billion $) | Overall Deficit (in billion $) |
|——|—————————–|———————————|——————————-|
| 2024 | 1,171 | 292 | 879 |
| 2023 | 1,150 | 280 | 870 |
| 2022 | 1,100 | 270 | 830 |
| 2021 | 1,050 | 250 | 800 |
| 2020 | 1,000 | 240 | 760 |
Detailed Analysis of the U.S. Trade Deficit in 2024
The U.S. trade deficit saw a notable increase in November 2024, reaching $102.86 billion, up from the revised figure of $98.3 billion in the previous month. This monthly change underscores ongoing challenges in balancing trade, as the deficit continues to widen. The economic implications of this trend include potential impacts on domestic production and employment, as a higher deficit often suggests increased reliance on foreign goods and services.
The rise in imports contributed significantly to the growing trade deficit. In November, imports surged by 4.5%, with notable increases across several categories. These include capital goods, consumer goods, industrial supplies, and automotive vehicles. Such growth in imports reflects strong domestic demand and possibly competitive pricing of foreign goods, which can affect domestic industries adversely by increasing competition.
Conversely, exports also experienced growth, rising by 4.4% in November 2024. The increase was primarily driven by higher shipments of industrial supplies, capital goods, and consumer goods. This rise in exports highlights certain strengths within the U.S. economy, particularly in sectors capable of competing on a global scale. Export growth can help mitigate trade deficits by boosting domestic production and supporting job creation within key industries.
The overall economic impact of the trade deficit is multifaceted, affecting both domestic and international markets. A persistent deficit can lead to a depreciation of the national currency, altering purchasing power and trade terms. Additionally, it can influence policy decisions, as governments may seek to address imbalances through tariffs or trade agreements, impacting international relations and economic stability.
- Capital goods (+4.3%)
- Consumer goods (+1.1%)
- Industrial supplies (+6.9%)
- Automotive vehicles (+3.2%)
U.S. Import and Export Data Insights for 2024
In 2024, the U.S. saw a notable increase in both imports and exports, reflecting dynamic changes in international trade. Imports surged by 3.4%, reaching $351.6 billion in November, while exports climbed by 2.7% to a record $273.4 billion. These figures highlight the growing complexity of global trade relationships and the U.S.'s role within them. Notably, while the trade deficit with China remained stable at $25.4 billion, it widened with the European Union, indicating shifting economic alliances and market conditions.
The main import categories for the year underscore the diverse needs of the U.S. economy. Foods, semiconductors, passenger cars, and crude oil were among the top imports, each playing a crucial role in sustaining domestic industries and consumer demands. For instance, semiconductors are essential for technological advancements and manufacturing, while crude oil remains a vital energy source. These imports not only support various sectors but also highlight the U.S.'s dependency on global supply chains for critical goods.
On the export front, petroleum products, passenger cars, and aircraft engines stood out as leading categories. These exports are significant contributors to the U.S. economy, driving innovation and job creation. The export of petroleum products reflects the U.S.'s capacity to refine and distribute energy resources globally. Similarly, the automotive and aerospace industries benefit from robust export activities, which enhance their competitiveness and economic resilience.
- Top Import Categories: Foods, Semiconductors, Passenger Cars, Crude Oil
- Top Export Categories: Petroleum Products, Passenger Cars, Aircraft Engines
Historical Context and Trends in U.S. Trade Balance
The U.S. trade balance has exhibited a persistent deficit from 1950 to 2024, averaging -$18.46 billion. This long-term trend underscores the structural nature of the trade imbalance, driven by a consistent demand for imports exceeding exports. Notable historical extremes include a $1.95 billion surplus in June 1975 and a -101.91 billion deficit in March 2022. These figures illustrate the fluctuating nature of trade balances influenced by economic cycles and policy shifts.
Several pivotal events have shaped the U.S. trade landscape over the decades. The establishment of the World Trade Organization (WTO) in 1995 and the North American Free Trade Agreement (NAFTA) in 1994 significantly impacted trade dynamics by reducing barriers and fostering international commerce. The Global Financial Crisis in 2008 led to a contraction in global trade, affecting the U.S. balance. More recently, the COVID-19 pandemic in 2020 disrupted supply chains and trade flows, further complicating the balance dynamics.
These fluctuations have profound long-term economic implications. For instance, periods of high deficits often correlate with increased foreign debt and currency depreciation. Such imbalances can influence domestic economic stability and necessitate policy interventions to address trade inequities. Understanding these historical patterns is crucial for forecasting future trends and formulating strategies to enhance trade competitiveness.
Line Graph Illustration Description:
- X-axis: Years from 1950 to 2024
- Y-axis: Trade Balance (in billion dollars)
- Highlight major historical events affecting trade
Economic Forecasts and 2024 Trade Policy Implications
As of 2024, the U.S. trade deficit is projected to reach -$80 billion by the end of the quarter. This forecast reflects ongoing challenges in balancing imports and exports, influenced by global economic conditions and domestic demand. In the short term, the deficit is expected to fluctuate due to market volatility and international trade dynamics. Long-term projections indicate a gradual narrowing of the deficit as trade policies and economic strategies aim to enhance competitiveness and reduce dependency on imports.
What are the anticipated changes in trade policies for 2024? Key policy changes include a focus on tariff adjustments, investment incentives, and strengthening trade negotiations. These changes are designed to mitigate trade imbalances by encouraging domestic production and improving export opportunities. By adjusting tariffs, the U.S. aims to create a more level playing field for domestic industries, while strategic investment flows are expected to bolster manufacturing capabilities and innovation.
The 2024 trade policies present both challenges and opportunities. What challenges do these policies face? One major challenge is the global economic environment, which can affect the effectiveness of domestic policies. Additionally, geopolitical tensions may impact trade negotiations, complicating efforts to secure beneficial agreements. However, these policies also offer opportunities to enhance market access and diversify trade partnerships, potentially leading to increased exports and economic growth.
Trade policy plays a crucial role in addressing economic challenges and fostering growth. By implementing effective policies, the U.S. can improve its trade balance and strengthen its global economic position. How can trade policy foster growth? Through targeted initiatives that enhance competitive markets, attract foreign investment, and support innovation, trade policy can drive sustainable economic development and resilience.
- Tariff Policies
- Investment Flows
- Trade Negotiations
- Enhancing Competitive Markets
Final Words
Understanding the U.S. trade balance statistics for 2024 offers valuable insights into the nation's economic landscape.
This year's data highlighted a significant trade deficit, primarily driven by a goods deficit while maintaining a services surplus.
Historically, the U.S. has grappled with a consistent goods trade deficit, impacted by fluctuating economic events.
In 2024, increased imports and exports have demonstrated the complexity of current trade dynamics, with notable sectors such as capital and consumer goods playing pivotal roles.
Looking ahead, trade policies aim to navigate these challenges, focusing on fostering competitive markets and adapting to the evolving economic climate.
These trends in trade balance statistics reflect both challenges and opportunities, promising a dynamic economic path forward.

