Key points from the chart
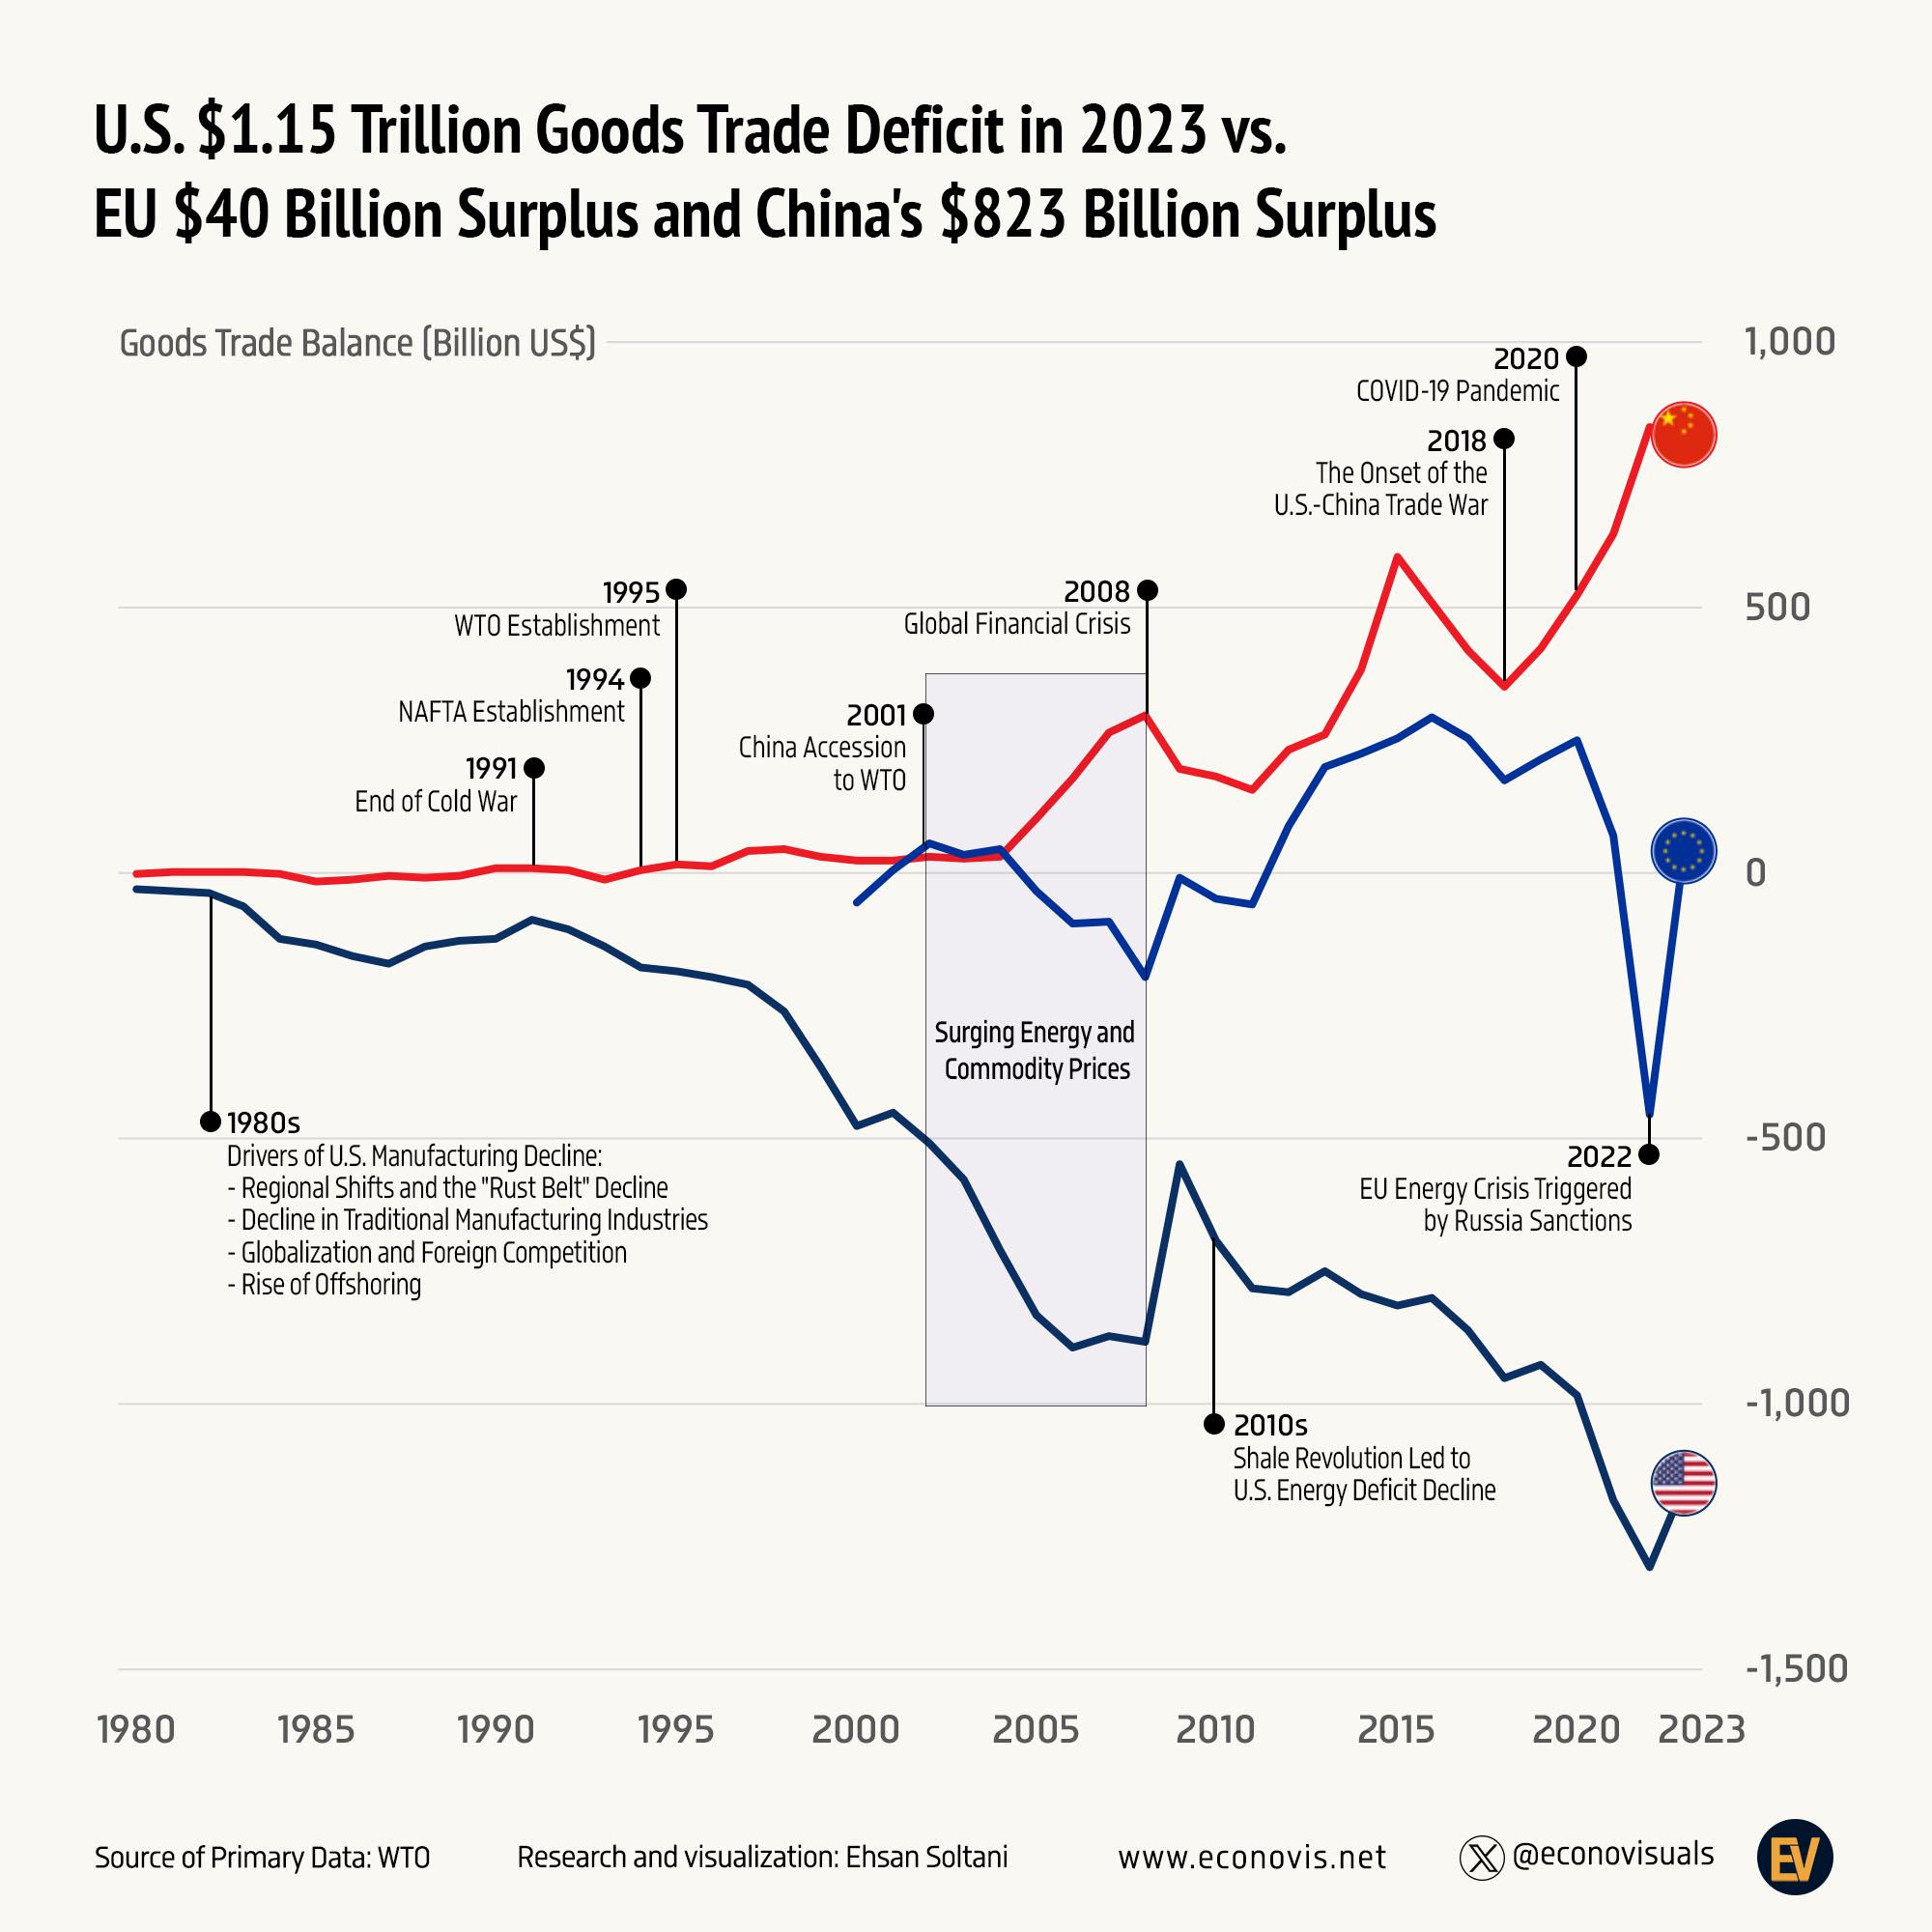
- The chart compares the goods trade balance of the United States, the European Union and China from 1980 to 2023, in billions of US dollars.
- Its headline figures for 2023 are a US goods trade deficit of $1.15 trillion, an EU surplus of $40 billion and a Chinese surplus of $823 billion.
- The US line stays below zero throughout and keeps falling, with its deepest point in 2022 before a partial recovery in 2023.
- China’s line stays near zero until the early 2000s, then climbs after its 2001 entry to the World Trade Organization.
- The EU line, which starts in 2000, moves around zero, rises into surplus in the 2010s, drops into a deep deficit in 2022 and returns to a small surplus in 2023.
The trade balance chart in text
Title: “U.S. $1.15 Trillion Goods Trade Deficit in 2023 vs. EU $40 Billion Surplus and China’s $823 Billion Surplus”. Vertical axis: Goods Trade Balance (Billion US$), from minus 1,500 to 1,000 in steps of 500. Horizontal axis: 1980 to 2023. Three lines are marked with flags at their ends: China in red, the EU in bright blue and the United States in dark navy.
A shaded band across the mid 2000s is labelled “Surging Energy and Commodity Prices”. Event labels, left to right:
- 1980s: Drivers of U.S. Manufacturing Decline, listed as regional shifts and the “Rust Belt” decline, decline in traditional manufacturing industries, globalisation and foreign competition, and the rise of offshoring.
- 1991: End of Cold War.
- 1994: NAFTA Establishment.
- 1995: WTO Establishment.
- 2001: China Accession to WTO.
- 2008: Global Financial Crisis.
- 2010s: Shale Revolution Led to U.S. Energy Deficit Decline.
- 2018: The Onset of the U.S.-China Trade War.
- 2020: COVID-19 Pandemic.
- 2022: EU Energy Crisis Triggered by Russia Sanctions.
Footer: Source of Primary Data, WTO. Research and visualisation, Ehsan Soltani. www.econovis.net, @econovisuals, and the Econovis EV logo.
What the lines show
The chart prints only the 2023 end values, so the earlier shape is described here from the lines rather than from printed numbers. The US deficit widens through the 1980s and 1990s and much faster after 2000. It narrows sharply around the 2008 financial crisis, then widens again to its low point in 2022 before narrowing in 2023.
China’s surplus starts to grow in the mid 2000s, dips after 2008, rises again in the mid 2010s, falls back around the 2018 trade war and then climbs to its highest level at the end of the chart. The EU line is the most changeable of the three, with its 2022 fall labelled on the chart as the energy crisis that followed sanctions on Russia.
Econovis’s post with the chart says the US deficit expanded significantly after 2000, largely driven by China’s rise as a manufacturing hub, and that the shale boom of the 2010s reduced the US energy trade deficit even as the overall deficit continued to widen [1].
How the chart compares with US Census figures
The US Census Bureau publishes the official US trade balance on a balance of payments basis. On that basis the US goods deficit was $1,057.5 billion in 2023, after $1,174.6 billion in 2022 [2]. That confirms the chart’s pattern, with 2022 deeper than 2023, though the Census figure for 2023 is lower than the chart’s $1.15 trillion. The chart uses WTO data, which is compiled on a different basis.
The Census table also shows that the US runs a surplus in services trade, $283.3 billion in 2023, which brings the total goods and services deficit down to $774.2 billion [2]. This chart covers goods only. The deficit has continued since: the Census table puts the goods deficit at $1,215.4 billion in 2024 and $1,240.9 billion in 2025 [2].
Notes on this infographic
- Goods only. The chart does not include services, where the US has a surplus [2]. Econovis’s post title calls it a “trade deficit”, but the chart’s own title correctly says goods.
- Different data basis. The $1.15 trillion US figure comes from WTO data. The official Census balance of payments figure for 2023 is $1,057.5 billion [2].
- EU line starts in 2000. The EU series does not cover the 1980s and 1990s.
- Events are labels, not proof. The chart places events next to turning points. It does not measure how much each one changed the balances.
Questions about the US trade deficit
What is a trade surplus vs a trade deficit?
A country has a trade surplus when it exports more than it imports, and a trade deficit when it imports more than it exports. On this chart, lines above zero are surpluses and lines below zero are deficits.
When was the last time the US had a trade surplus?
In 1975. The Census Bureau’s balance of payments table shows a goods and services surplus of $12.4 billion that year, and a deficit in every year since [2].
What is the US balance of trade?
The most recent full year in the Census table is 2025, with a goods and services deficit of $901.5 billion, made up of a $1,240.9 billion goods deficit and a $339.5 billion services surplus [2].
Sources
- Econovis, U.S. $1.15 Trillion Trade Deficit vs. EU $40 Billion Trade Surplus and China $823 Billion Trade Surplus in 2023 (4 January 2025), the creator’s post of this chart.
- US Census Bureau, U.S. Trade in Goods and Services, Balance of Payments Basis, 1960 through 2025 (PDF).
Last reviewed 30 October 2026