Baby Boomers hold just over half of all US household wealth. In the second quarter of 2026 they had $97.4 trillion, 52.5% of the total, according to the Federal Reserve’s Distributional Financial Accounts. Gen X held $47.7 trillion (25.7%), Millennials and younger $20.8 trillion (11.2%) and the Silent Generation and older $19.8 trillion (10.7%). For the first time, Millennials now hold more wealth than the Silent Generation.
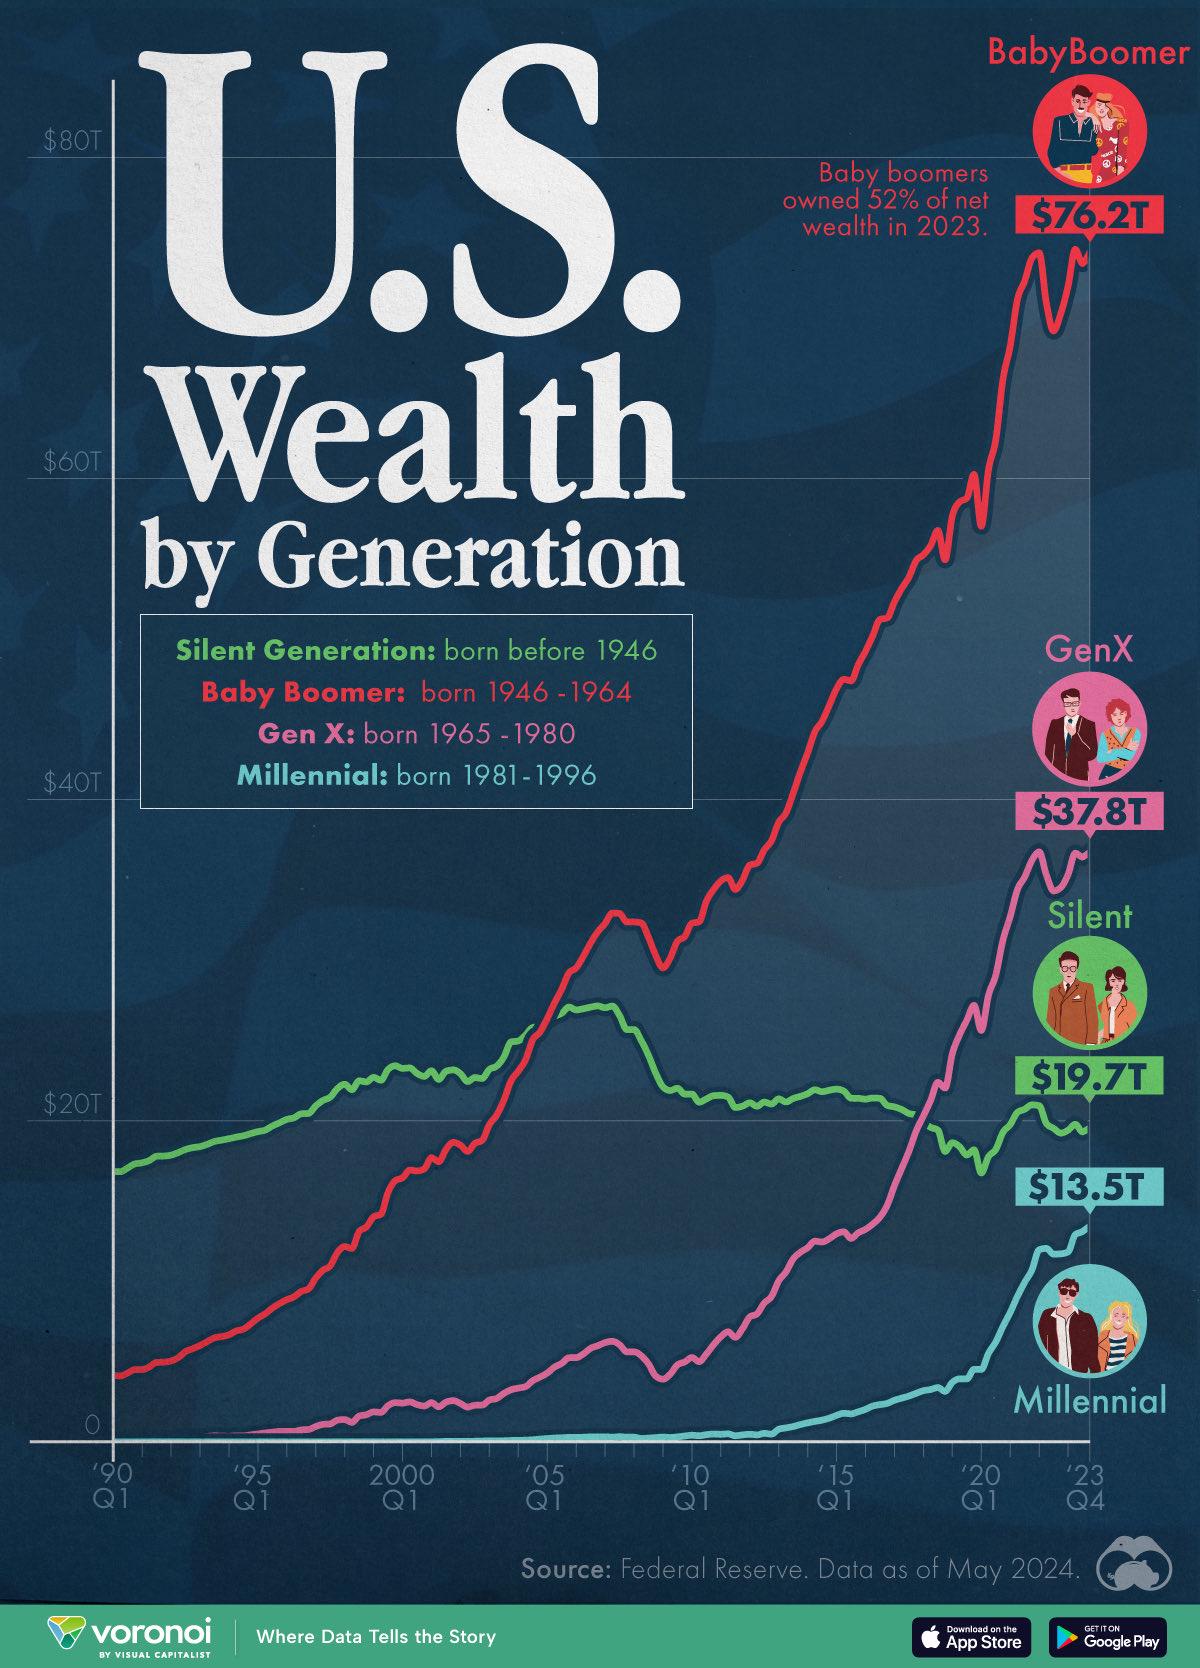
The infographic by Visual Capitalist charts the same Federal Reserve series from 1990 to the end of 2023, when Boomers held $76.2 trillion, or 52% of the total. This article uses the latest quarter of the data to explain how wealth is split between the generations, how that split has changed since 1990, and what each generation’s wealth is made of.
US wealth distribution by generation in 2026
The Boomers’ share is roughly double Gen X’s and nearly five times the Millennials’. These are the latest figures from the Federal Reserve’s Distributional Financial Accounts (DFA), for the second quarter of 2026. Total US household net worth in the series was $185.7 trillion.
| Generation | Born | Net worth, Q2 2026 | Share of US wealth | Net worth, Q4 2023 |
|---|---|---|---|---|
| Silent Generation and earlier | Before 1946 | $19.8 trillion | 10.7% | $19.7 trillion |
| Baby Boomers | 1946 to 1964 | $97.4 trillion | 52.5% | $75.9 trillion |
| Gen X | 1965 to 1980 | $47.7 trillion | 25.7% | $37.5 trillion |
| Millennials and younger | 1981 or later | $20.8 trillion | 11.2% | $13.5 trillion |
The Q4 2023 column uses the Federal Reserve’s current, revised figures. The infographic, drawn from data published in May 2024, shows slightly higher values for Boomers ($76.2 trillion) and Gen X ($37.8 trillion). The Fed revises the series as new data comes in, so older charts rarely match the latest table exactly.
One point to watch with these figures is that the Fed’s youngest group covers everyone born in 1981 or later. The infographic labels it “Millennial, born 1981 to 1996”, but its $13.5 trillion also includes Gen Z. The Fed does not publish a separate figure for Gen Z, so any Gen Z wealth total you see elsewhere comes from a different source or method.
How the generational wealth gap has changed since 1990
The Silent Generation held about 80% of US household wealth when the Fed’s series starts in 1989, and Boomers held about 20%. As Boomers moved through their peak earning years and their homes and investments rose in value, the balance swung the other way. Boomers first held more wealth than the Silent Generation in the second quarter of 2005, Gen X passed the Silent Generation in early 2018, and Millennials and younger passed it in the second quarter of 2026 (our reading of the Fed’s quarterly series).
| End of year | Silent and earlier | Baby Boomers | Gen X | Millennials and younger |
|---|---|---|---|---|
| 1990 | $17.0 trillion | $4.3 trillion | $0.1 trillion | $0 |
| 2000 | $22.9 trillion | $16.8 trillion | $2.3 trillion | $0 |
| 2005 | $26.5 trillion | $28.1 trillion | $4.9 trillion | $0.2 trillion |
| 2010 | $21.5 trillion | $34.4 trillion | $6.1 trillion | $0.5 trillion |
| 2015 | $21.1 trillion | $47.9 trillion | $12.9 trillion | $1.8 trillion |
| Q2 2026 | $19.8 trillion | $97.4 trillion | $47.7 trillion | $20.8 trillion |
All figures are in current dollars, not adjusted for inflation, from the Federal Reserve’s DFA. Boomer wealth has grown more than twentyfold since 1990, partly because the generation got older and partly because US share and house prices rose so much over the period. The 2008 financial crisis set every generation back. Gen X, then in its thirties and forties and carrying large mortgages, saw its wealth fall from $6.3 trillion in the third quarter of 2007 to $3.9 trillion in early 2009, a drop of more than a third, and did not get back to its pre-crisis level until 2011.
Some of the gap is simply age. People build wealth over their working lives and draw it down in retirement, so a generation of people in their sixties and seventies will always hold more than one in its thirties. The Silent Generation’s total peaked at $27.0 trillion in early 2007 and has been lower since, as its members have died, spent their savings or passed money on.
Are Millennials catching up?
Millennials are building wealth faster than their headline share suggests, but from a much lower base. Their net worth rose from $1.8 trillion at the end of 2015 to $20.8 trillion in the second quarter of 2026, and their share of US wealth went from 9.2% at the end of 2023 to 11.2%, according to the Fed’s figures. Housing has been the biggest driver. The real estate held by Millennials and younger rose from $3.5 trillion in early 2020 to $11.2 trillion in the second quarter of 2026, as more of them bought homes and house prices rose.
Debt is still a much bigger part of the Millennial picture than for older groups. In the second quarter of 2026, Millennials and younger held 22.4% of US household real estate but carried 42.6% of household debt, against 20.8% for Boomers and 2.1% for the Silent Generation. Most of that debt is mortgages, so it is backed by homes, but it means a fall in house prices hits younger households hardest.
What each generation’s wealth is made of
Older generations hold more of their wealth in shares and pensions, while younger ones hold more in their homes. In the second quarter of 2026 Boomers owned 54.5% of all corporate shares and mutual funds held by US households, worth $35.2 trillion, according to the Fed’s DFA. Their real estate was worth $20.5 trillion.
For Millennials and younger it is the other way round. Their real estate was worth $11.2 trillion and their shares and mutual funds $6.0 trillion. Gen X sits in between, with $14.3 trillion in real estate and $14.3 trillion in shares and mutual funds. This is why stock market rallies tend to widen the gap between the generations, while rising house prices narrow it slightly.
Generational wealth and the coming transfer
“Generational wealth” is also used to mean money and property passed down within a family. Because Boomers and the Silent Generation hold about 63% of US household wealth between them, a large share of it is expected to pass to Gen X, Millennials and charities over the next few decades through inheritances and gifts during their lifetimes. How much actually passes on depends on how long people live, what they spend on care in later life and how much they give away, so estimates of the size of the transfer vary widely.
The DFA figures are totals for each generation, not averages. Wealth within each generation is very unevenly spread, so most of the transfer will go to a minority of heirs. For how wealth is split by income and wealth group rather than age, see our page on US wealth distribution, and for the picture outside the US, global wealth distribution.
Questions about generational wealth distribution
Which generation has the most wealth?
Baby Boomers, with $97.4 trillion or 52.5% of US household wealth in the second quarter of 2026, according to the Federal Reserve. They have been the wealthiest generation since 2005.
What percentage of wealth do Boomers hold?
52.5% in the second quarter of 2026, up from 51.8% at the end of 2023. The infographic rounds the 2023 figure to 52%.
How much wealth do Millennials have?
The Fed’s Millennial group, which includes everyone born in 1981 or later, held $20.8 trillion in the second quarter of 2026, 11.2% of US household wealth.
How much wealth does Gen X have?
$47.7 trillion in the second quarter of 2026, 25.7% of the total. Gen X’s share was about 15% in 2013, according to the same Fed series.
Does Gen Z have its own figure?
Not in the Federal Reserve’s DFA. Gen Z is counted inside the Millennial group, which covers everyone born from 1981 onwards.
How often is the data updated?
Every quarter. The Fed updates the DFA a few months after each quarter ends, after its main Financial Accounts release, so the next figures will cover the third quarter of 2026.
Sources
- Federal Reserve, Distributional Financial Accounts, distribution of household wealth by generation, levels and shares data to Q2 2026, downloaded 16 November 2026. Generation definitions from the DFA’s distribution chart page.
- Visual Capitalist, Charted: U.S. Wealth by Generation, by Bruno Venditti, 27 June 2024 (archived copy).