What are the 5 social classes in the US?
A common five-class breakdown, used in the chart above and based on the class guide from the US nonprofit Resource Generation [1], has poor, working, middle, upper and owning classes. The income brackets are individual pre-tax income for full-time work, as national averages, so the real cut-offs vary with where you live.
| Class | Share of people | Share of wealth | Individual income |
|---|---|---|---|
| Poor or lower class | About 20% | 1% | $0 to $32,000 |
| Working class | About 40% | 3% | $32,000 to $70,000 |
| Middle class | About 20% | 8% | $70,000 to $106,000 |
| Upper class | About 19% | 48% | $106,000 to $461,000 |
| Owning class | About 1% | 40% | Over $461,000 |
Wealth is spread very unevenly. On these figures the top fifth of Americans (upper and owning class) hold 88% of the country’s wealth, while the bottom three fifths (poor and working class) hold 4% (our sums).
Poor or lower class
People in the poor class are often underemployed or underpaid and may rely on public benefits. Housing tends to be substandard or unstable, there is little access to higher education, and debt usually comes from predatory lending, monthly bills and emergencies [1]. Resource Generation describes a chronic lack of necessities and frequent involuntary moves [1].
Working class
The working class is the largest group on this model. Its jobs are mostly labour, service or care work with little control over pay or benefits. Many people rent, or have most of their wealth tied up in a home, and live paycheck to paycheck with little or no savings. Debt comes from education, medical bills and credit cards [1].
Middle class
The middle class depends on wages or salaries to pay the bills, usually with some control over pay and benefits. Home ownership or stable renting is typical, college is generally expected (often with student loans), and debt is mainly mortgages, education and medical bills. Employment is stable but can become precarious after a large medical bill or a layoff [1].
Upper class
The upper class (Resource Generation calls it managerial or upper class) lives on salaries from mid- to high-level professional and managerial jobs rather than investments. Typical markers are owning one or more homes, travel, education at selective colleges often without student loans, some stock market investment and the chance of a significant inheritance [1]. Resource Generation notes that many people in this group see themselves as middle class [1].
Owning class
The owning or ruling class has enough income from assets such as shares and bonds that full-time work is optional. It passes down large inheritances, attends elite schools and colleges without loans, and includes the people Resource Generation describes as holding most decision-making power: billionaires, major chief executives and senior office holders [1].
How much income puts you in each class?
There is no official answer, and the cut-off depends on whether you count individual or household income and where you live. Three widely used measures give quite different figures.
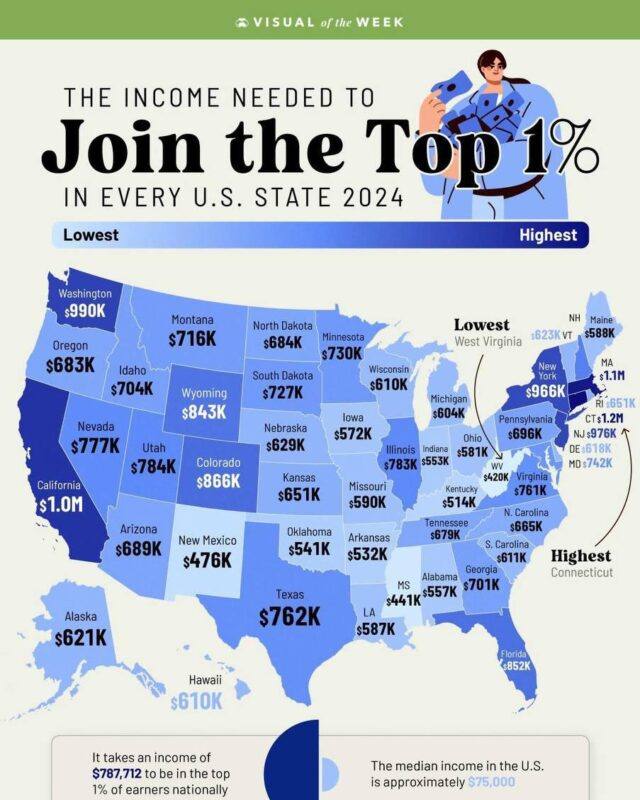
- Individual income (the chart above). Middle class runs from $70,000 to $106,000 and upper class from $106,000 to $461,000 for one full-time earner. The chart takes its income data from the DQYDJ income percentile calculator [6].
- Household income (Resource Generation’s current guide). Under $33,000 for poor and working-poor households, $33,000 to $82,000 working class, $83,000 to $160,000 middle class, $160,000 to $600,000 upper class and over $600,000 owning class [1]. The guide also gives household net worth bands, from under $15,000 for the poorest group to over $11.6 million for the owning class [1].
- Pew Research Center. Pew counts a household as middle income if it earns between two-thirds and double the national median, adjusted for household size. In 2022 that was about $56,600 to $169,800 for a household of three, with lower income below $56,600 and upper income above $169,800 [2].
For a sense of the middle, US median household income was $87,460 in 2025 [5].
Who owns the wealth in America?
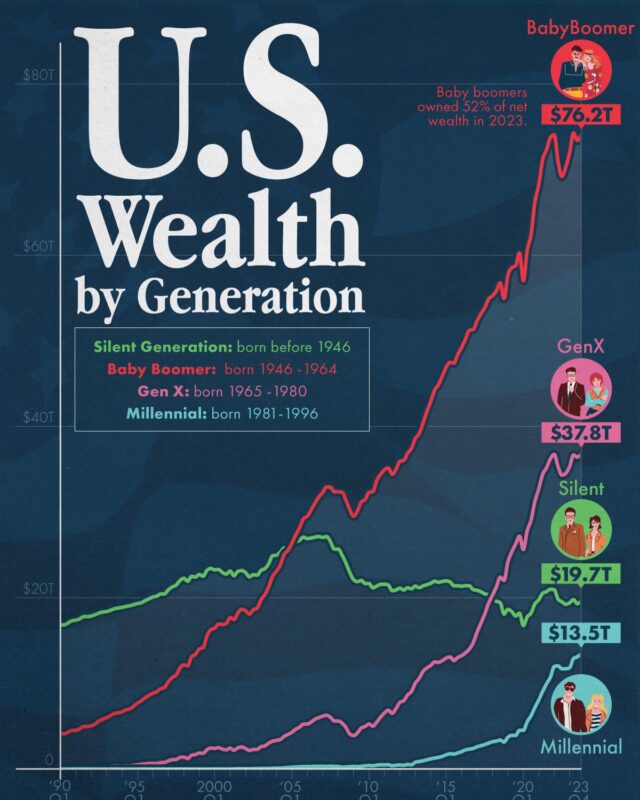
Wealth is far more concentrated than income. Federal Reserve figures for the second quarter of 2026 show the top 1% of households holding 32.5% of all net worth, the next 9% holding 36.4%, the next 40% holding 28.8% and the bottom half just 2.3% [4]. In other words, the richest tenth own about 69% of household wealth (our sum).
Those figures line up with the class guide. Resource Generation’s current version says the top 1% control roughly 32% of net wealth and the poorest group, about 12% of people, has negative net worth overall [1]. The chart above gives the owning class 40% and the upper class 48%, which differ from the guide’s current figures; the exact shares vary by source and year, but every measure shows a small group owning most of the wealth.
How many social classes are there in the US?
It depends on the model. Many Americans think in three classes: rich, middle class and poor [3]. Sociologists tend to use more. The model by sociologist Dennis Gilbert has six classes, defined by household income, education and how much control people have over their work [3]:
- Capitalist class, the top 1%, typical income about $1.5 million, mostly from assets.
- Upper middle class, the next 14%, typical income about $200,000 (and about $500,000 for the “working rich”).
- Lower middle class, the next 30%, typical income about $85,000.
- Working class, the next 25%, typical income about $40,000.
- Working poor, the next 15%, typical income about $25,000.
- Underclass, the bottom 15%, typical income about $15,000.
Gilbert argues the biggest divide is between the top two “privileged” classes and the other four [3]. Other approaches simply split households into income fifths, as the New York Times has done, or into three income tiers, as Pew does: in 2022, 52% of US adults lived in middle-income households, 28% in lower-income and 19% in upper-income households [2][3].
What decides your class besides income?
Income is only part of it. Most class models also look at wealth, education, type of work and social networks [3]. Resource Generation defines class as “a system of power based on perceived social and economic status” and stresses that class and money are connected but not the same thing [1]. Someone raised in an owning-class family who goes bankrupt still has the family safety net, education and connections, while someone raised working class who reaches a high salary does not inherit the same advantages [1].
This is why the five classes differ as much in housing, education and debt as in pay. A household in the upper class tends to carry mortgage and lifestyle debt, while a poor household’s debt comes from covering basic expenses [1]. Resource Generation also argues that most people in the US have limited class mobility, and that the class you grow up in is the main factor in where you end up [1].
Questions about classes in the USA
What are the 5 classes in the US?
On the widely used five-class model, they are the poor or lower class, working class, middle class, upper class and owning class [1]. Roughly 20%, 40%, 20%, 19% and 1% of people fall into each, on the figures shown in the chart.
How many classes are there in the US?
There is no official number. Popular usage has three (upper, middle and lower), many sociologists use six, and some models use as many as a dozen [3].
What are the six social classes?
In Dennis Gilbert’s model: capitalist class, upper middle class, lower middle class, working class, working poor and underclass [3].
What income is middle class in the US?
On Pew’s definition, a three-person household was middle income in 2022 with between about $56,600 and $169,800 a year, adjusted for local living costs [2]. Resource Generation’s guide uses $83,000 to $160,000 of household income [1].
How much wealth does the top 1% own in the US?
About a third. Federal Reserve data put the top 1%’s share of US household net worth at 32.5% in the second quarter of 2026 [4].
Sources
- Resource Generation, Class Distinctions and Income Brackets, the source of the chart’s wording.
- Pew Research Center, Are you in the American middle class?, 16 September 2024.
- Wikipedia, Social class in the United States.
- Board of Governors of the Federal Reserve System, Distributional Financial Accounts via FRED, Share of Net Worth Held by the Top 1% (with the matching series for the 90th to 99th, 50th to 90th and bottom 50% groups).
- US Census Bureau via FRED, Median Household Income in the United States.
- DQYDJ, Income percentile calculator, the chart’s stated income source.
Last reviewed 2 November 2026