China’s M2 is more than twice the size of US M2. At the end of September 2026 China’s broad money stood at RMB359.63 trillion, about $53.6 trillion at the Federal Reserve’s average exchange rate for that month, against US M2 of $23.4 trillion. Between December 2021 and December 2024 China’s M2 grew 15.1% in dollar terms while US M2 slipped 0.1%.
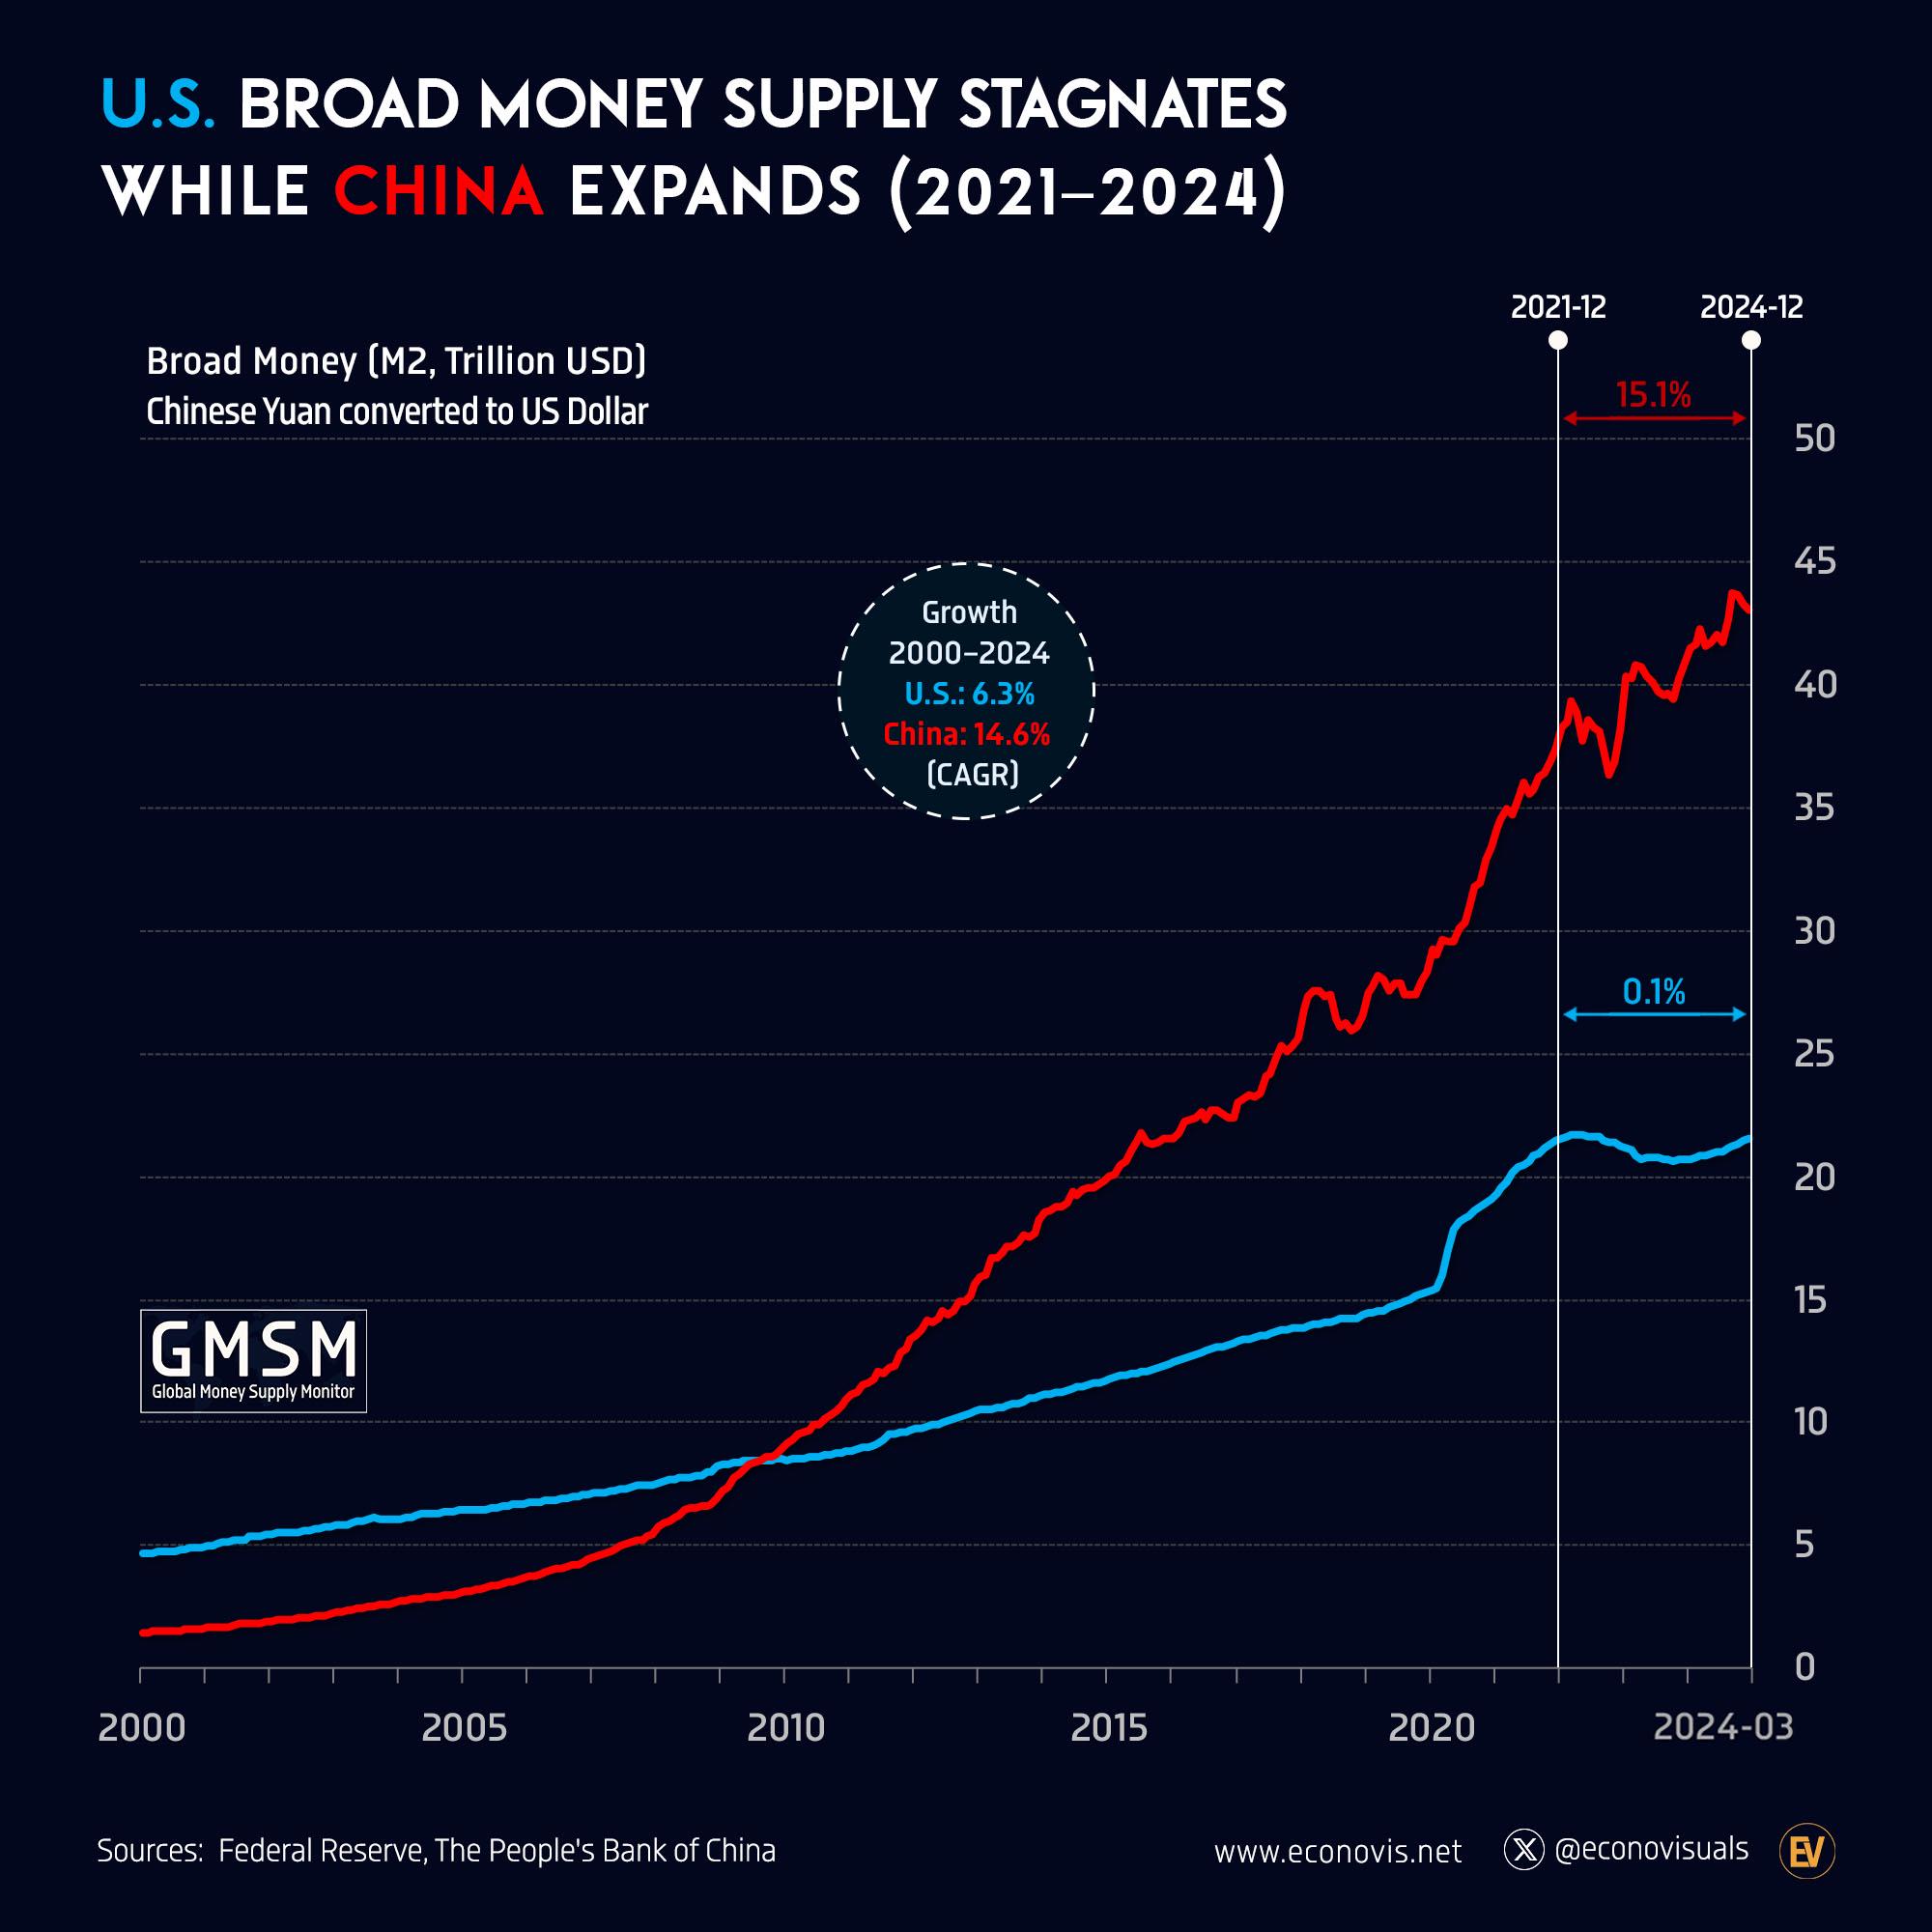
The chart by Econovis, shown here, follows both countries’ M2 in US dollars from 2000 to the end of 2024, using Federal Reserve and People’s Bank of China data [1]. Below we check its figures against both central banks and bring them up to date. For how US M2 has tracked the stock market, see our page on the S&P 500 vs US M2 money supply.
China M2 vs US M2 in numbers
China overtook the US on this measure around 2009, as the Econovis chart shows, and has pulled well ahead since [1]. These are the official M2 figures, with China’s converted at the Federal Reserve’s monthly average yuan to dollar rate [2][3][4][5].
| Date | China M2 (yuan) | China M2 (US dollars) | US M2 (US dollars) | China as a multiple of US |
|---|---|---|---|---|
| December 2021 | RMB238.29 trillion | $37.4 trillion | $21.49 trillion | 1.7 times |
| December 2024 | RMB313.53 trillion | $43.1 trillion | $21.46 trillion | 2.0 times |
| December 2025 | RMB340.29 trillion | $48.3 trillion | $22.33 trillion | 2.2 times |
| September 2026 | RMB359.63 trillion | $53.6 trillion | $23.41 trillion | 2.3 times |
Dollar conversions and multiples are our calculation, using the Fed’s average rates of 6.3693 yuan per dollar in December 2021, 7.2807 in December 2024, 7.0432 in December 2025 and 6.7084 in September 2026 [5]. US M2 is the Fed’s seasonally adjusted series [4].
Why China’s money supply grew faster from 2021 to 2024
China kept creating money while the US money supply stood still. In yuan, China’s M2 rose 31.6% between the end of 2021 and the end of 2024, from RMB238.29 trillion to RMB313.53 trillion, according to the People’s Bank of China [2][3]. Over the same three years US M2 went from $21,488.2 billion to $21,462.0 billion, according to the Federal Reserve [4].
The 15.1% growth for China on the Econovis chart is correct in dollar terms, and our check with the Fed’s exchange rates gives the same figure [1][5]. It is about half the growth in yuan because the yuan weakened from 6.37 to 7.28 per dollar over the period [5]. So the chart understates how fast China’s money supply grew in its own currency.
The chart’s US figure needs a correction. It shows US growth of 0.1%, but on the Federal Reserve’s series US M2 fell by 0.1% from December 2021 to December 2024 [4]. Either way it was close to flat.
The two central banks were going in opposite directions. The Fed raised interest rates sharply from 2022 and shrank its balance sheet to bring down inflation, and US M2 fell from $21,750.8 billion in April 2022 to $20,712.3 billion in October 2023, a drop of 4.8% [4]. The People’s Bank of China was easing policy to support a weak economy and property market, and China’s M2 grew by 7.3% in 2024 alone [3].
Long term growth since 2000
Over the whole period China’s money supply has grown more than twice as fast as America’s. The Econovis chart gives compound annual growth from 2000 to 2024 of 14.6% for China and 6.3% for the US, both in dollars [1].
The US figure checks out. US M2 grew from $4,666.1 billion in January 2000 to $21,462.0 billion in December 2024, which is 6.3% a year by our arithmetic from the Fed’s series [4]. China’s long run rate depends heavily on the exchange rate, which was fixed at about 8.28 yuan to the dollar in 2000 and has been far stronger since [5].
China money supply today
China’s M2 is still growing at around 7% a year. The People’s Bank of China reported broad money of RMB359.63 trillion at the end of September 2026, up 7.2% on a year earlier, after growth of 8.5% in 2025 [6][7]. Narrow money (M1) was RMB116.76 trillion, up 3.2% [6].
US M2 has started growing again after its 2022 to 2023 fall. It reached $23,413.9 billion in September 2026, up 9.1% on December 2024 [4]. The yuan has also strengthened, to 6.68 per dollar in October 2026, which pushes China’s M2 up further when you measure it in dollars [5].
Why China’s M2 is so much larger than America’s
A larger M2 does not mean China has a larger economy. The US economy is bigger in dollar terms, but China’s money supply is more than twice as large because of how its financial system works.
Most saving and lending in China goes through banks, so household and company savings sit as bank deposits, which count in M2. In the US a much larger share of savings is held in shares, bonds and pension funds, which don’t count in M2. Comparing M2 across countries therefore tells you more about how money is held than about how much spending power each economy has. China’s M2 and America’s M2 are also defined slightly differently, so the comparison is a broad one rather than like for like.
What M2 money supply means
M2 is a broad measure of the money in an economy. It covers cash plus bank deposits that can be spent or turned into cash quickly.
In the US, the Federal Reserve calculates M2 as M1 (cash and checkable deposits, including savings deposits since 2020) plus small time deposits under $100,000 and balances in retail money market funds, less money held in retirement accounts [4]. In China, the People’s Bank of China counts cash in circulation (M0) and demand deposits as M1, then adds time and savings deposits held by companies and households, and some other deposits, to give M2.
Questions about China M2 vs US M2
Is China’s money supply bigger than the US?
Yes. China’s M2 was about $53.6 trillion at the end of September 2026, against $23.4 trillion for the US, so roughly 2.3 times larger [4][5][6]. On the Econovis chart, China’s M2 passes the US figure in dollar terms around 2009 [1].
How is the money supply calculated?
Central banks add up cash in circulation and deposits held at banks. The narrow measure (M1) covers cash and deposits you can spend straight away. The broad measure (M2) adds savings, time deposits and, in the US, retail money market funds [4].
Did US M2 fall between 2021 and 2024?
Yes, slightly. US M2 was $21,488.2 billion in December 2021 and $21,462.0 billion in December 2024, a fall of 0.1% [4]. In between it dropped further, to $20,712.3 billion in October 2023.
Is China’s currency RMB or CNY?
Both refer to the same currency. Renminbi (RMB) is the name of the currency and the yuan is its unit, while CNY is the international currency code used in markets. That is why China’s money supply figures are reported as RMB trillion.
Sources
- Econovis, Global Money Supply Monitor, U.S. broad money supply stagnates while China expands (2021 to 2024).
- People’s Bank of China, Financial Statistics Report (2021).
- People’s Bank of China, Financial Statistics Report (2024).
- Board of Governors of the Federal Reserve System, M2 (M2SL), via FRED, Federal Reserve Bank of St. Louis, data to September 2026.
- Board of Governors of the Federal Reserve System, Chinese Yuan Renminbi to US Dollar Spot Exchange Rate (EXCHUS), via FRED, monthly averages.
- People’s Bank of China, Financial Statistics Report (Q1 to Q3 2026), 14 October 2026.
- People’s Bank of China, Financial Statistics Report (2025).