How much do the US and China trade?
US Census Bureau figures show goods trade between the two countries falling steeply after the 2025 tariff increases [2]:
| Year | US exports to China | US imports from China | US balance |
|---|---|---|---|
| 2018 | $120.3bn | $538.5bn | -$418.2bn |
| 2022 | $154.0bn | $536.3bn | -$382.3bn |
| 2023 | $147.6bn | $427.2bn | -$279.6bn |
| 2024 | $143.3bn | $440.3bn | -$297.0bn |
| 2025 | $106.0bn | $308.7bn | -$202.7bn |
| 2026, January to August | $73.9bn | $183.5bn | -$109.6bn |
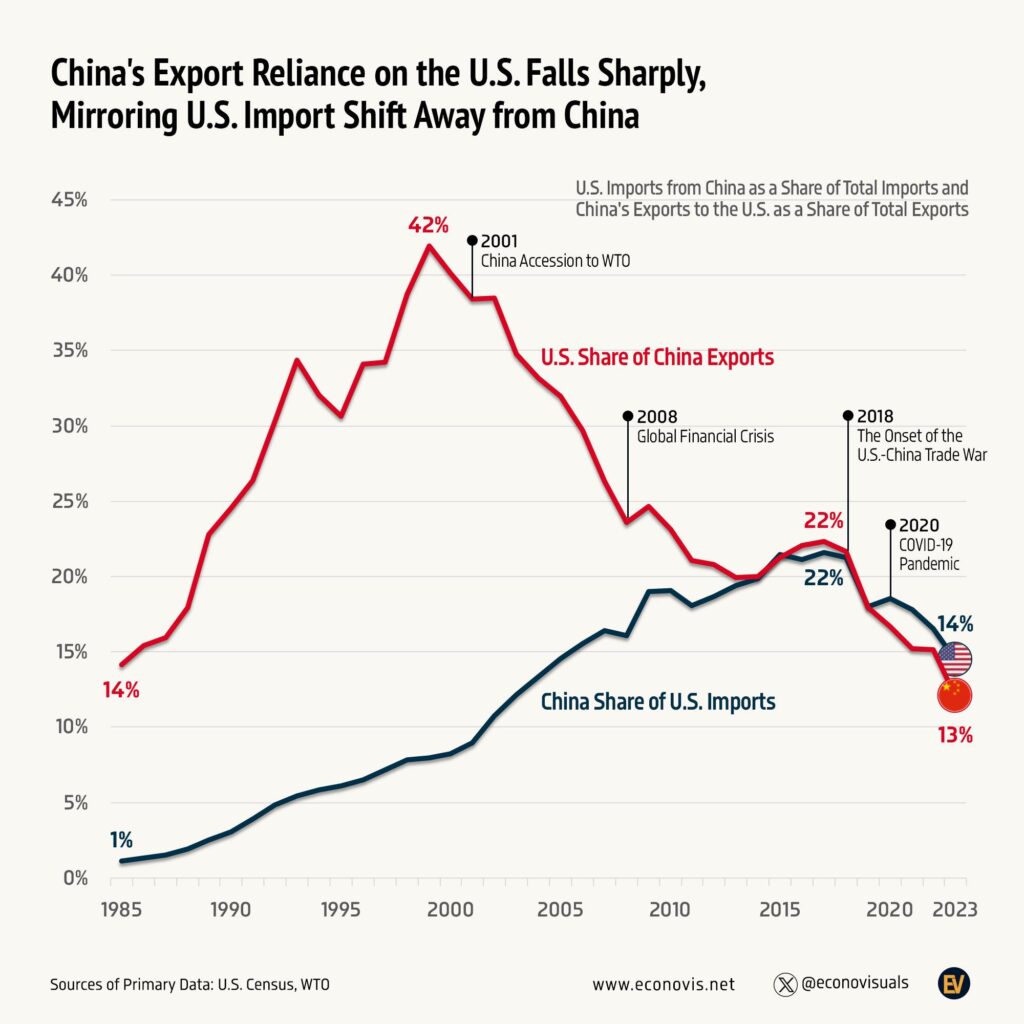
In 2025, US imports from China were 42% lower than in 2022 and US exports to China were 31% lower (our arithmetic) [2]. Total two-way goods trade fell from about $690 billion to about $415 billion. Monthly imports from China have been rising again in 2026, from about $19 billion to $21 billion a month early in the year to about $27 billion in July and August [2].
Why US China trade has fallen
The main reason is tariffs. In the first Trump administration (2018 to 2019), the US put tariffs on a large share of Chinese goods and China retaliated, a period known as the US-China trade war [3]. In 2025 the second Trump administration raised them much further: a 20% “fentanyl tariff”, then a 34% “Liberation Day” duty in April, escalating within days to a 145% tariff on Chinese goods and a 125% Chinese tariff on American goods [3]. A truce on 12 May 2025 cut the US rate to 30% and China’s to 10%, and at the Busan summit in October 2025 the US cut its fentanyl tariff by 10 points while China suspended its rare earth export restrictions for a year [3]. In February 2026 the US Supreme Court struck down the tariffs imposed under the International Emergency Economic Powers Act in Learning Resources v. Trump [3].
Tariffs are probably not the only factor. Some companies have moved production or final assembly from China to other countries, so part of the fall in bilateral figures may reflect goods arriving from elsewhere rather than a matching fall in reliance on Chinese supply chains.
What the US and China each sell to the world
The World Charts graphic above compares the two economies’ trade with the whole world in 2022, using World Trade Organization figures. It shows why the US runs a deficit with China: the two economies make and buy very different things [1][4].
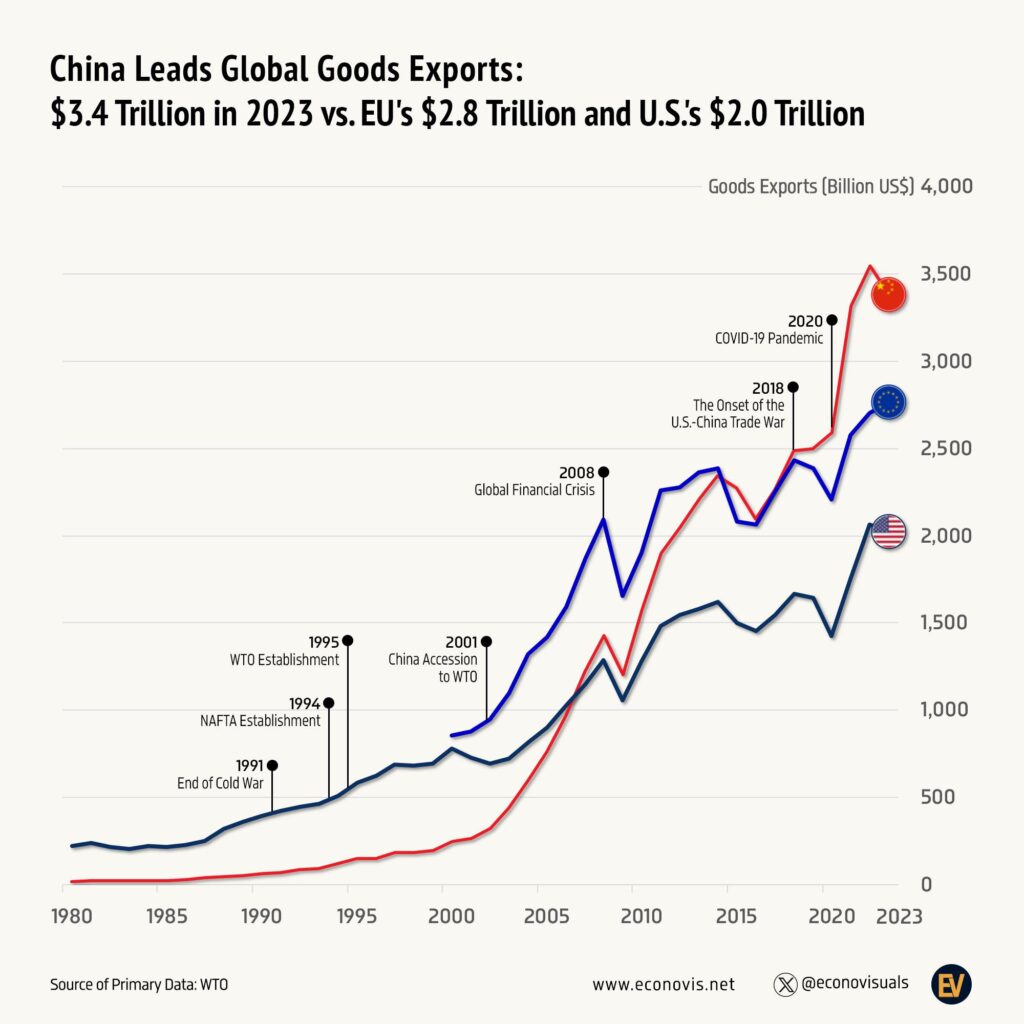
- Totals. China was the world’s largest goods exporter in 2022 with $3.59 trillion, 14.4% of the world total; the US was second with $2.07 trillion. For imports the order flips: the US bought $3.38 trillion of goods, 13.2% of world imports, and China $2.72 trillion [1].
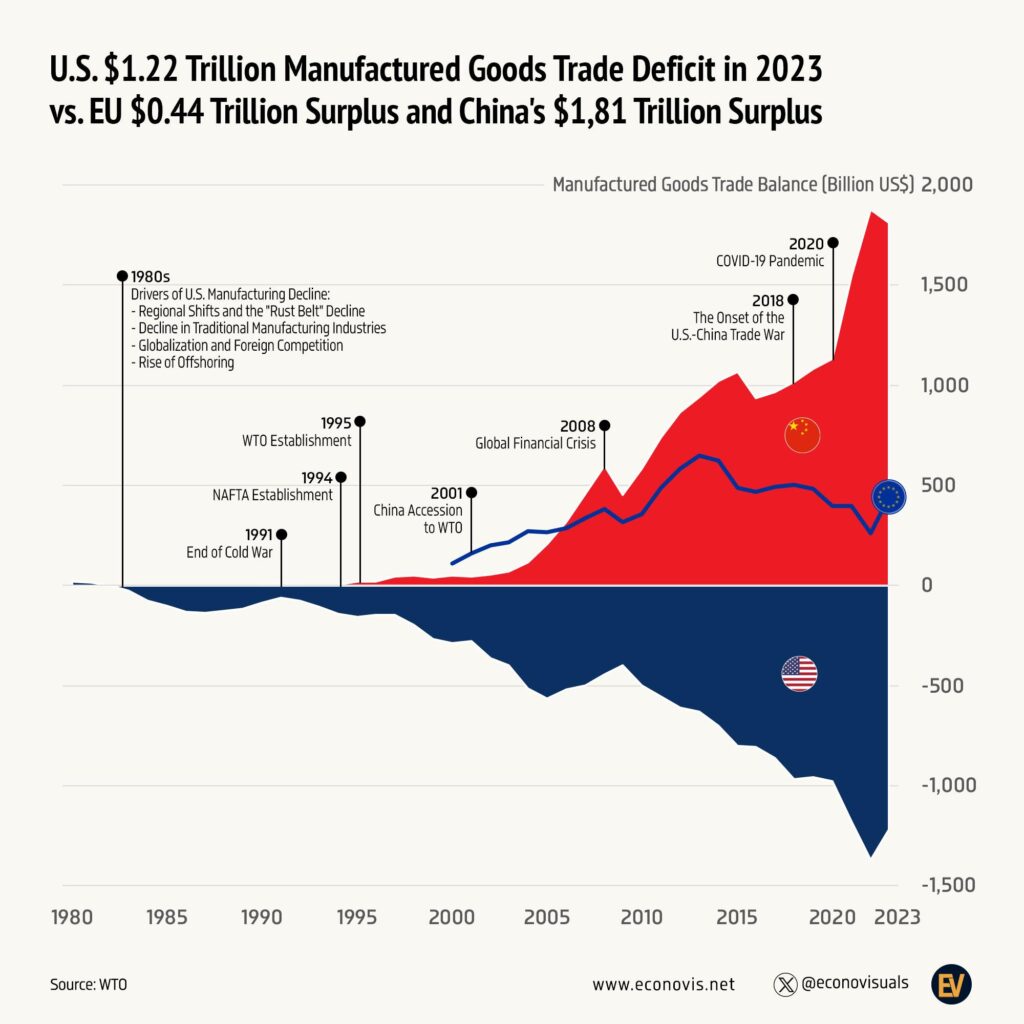
- Manufactures. China exported $3.32 trillion of manufactured goods, nearly three times the US figure of $1.20 trillion. The gap is widest in office and telecom equipment ($782 billion against $166 billion), textiles ($148 billion against $14 billion) and clothing ($182 billion against $7 billion) [1].
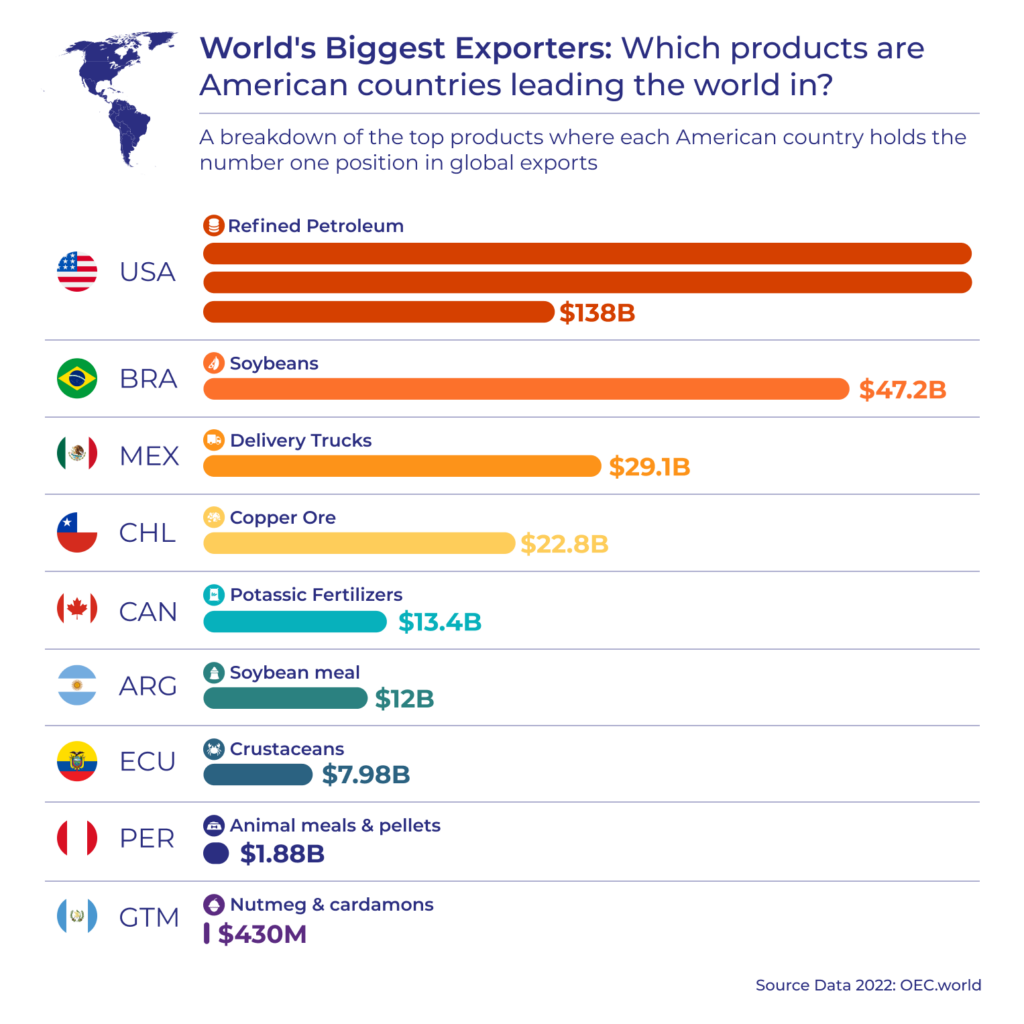
- Farm goods and fuels. Here the US leads. It exported $222 billion of agricultural products against China’s $103 billion, and $441 billion of fuels and mining products against $119 billion. China imported $886 billion of fuels and mining products, more than twice the US figure [1].
- Chemicals. Close to level, at $307 billion of US exports and $300 billion from China [1].
So the pattern of US-China trade follows the pattern of each economy: the US is relatively strong in farm products, energy and chemicals, while China dominates manufactured goods such as electronics, textiles and clothing [1].
The US trade deficit with China
The US goods deficit with China peaked at $418 billion in 2018 and was still $382 billion in 2022 [2]. It fell to $203 billion in 2025, about half the 2018 level [2]. A bilateral deficit is not in itself a loss: it reflects what each country produces and consumes. These figures also cover goods only, not services.
Questions about US China trade
How much does the US import from China?
$308.7 billion of goods in 2025, down from $536.3 billion in 2022 [2].
How much does the US export to China?
$106.0 billion of goods in 2025, down from $154.0 billion in 2022 [2].
What is the US trade deficit with China?
$202.7 billion in goods in 2025, and $109.6 billion for January to August 2026 [2].
Who exports more, China or the US?
China. In 2022 it exported $3.59 trillion of goods against $2.07 trillion from the US, though the US imported more [1].
What tariffs does the US have on China?
They peaked at 145% in April 2025 and were cut to 30% in the May 2025 truce, with further cuts after the October 2025 Busan summit. In February 2026 the Supreme Court struck down the tariffs imposed under emergency powers [3]. Rates change often, so check current US government notices before relying on a figure.
Sources
- World Trade Organization, World Trade Statistical Review 2023, figures for 2022, the source named on this chart.
- US Census Bureau, Trade in Goods with China.
- Wikipedia, China-United States trade war.
- World Charts, worldcharts.substack.com, the publisher of this chart.
Last reviewed 2 November 2026