How GDP and energy consumption are linked
Richer countries use far more energy per person than poorer ones, and the link is one of the strongest in economics. On the chart on this page, made by the Energy for Growth Hub with US Energy Information Administration and World Bank data for 2021, the fit between GDP per person and electricity use per person, plotted on log scales, has an R² of 0.8, meaning income accounts for roughly 80% of the variation in electricity use between countries [1]. The Hub’s later versions, using newer data, give almost the same result: R² of 0.83 for 2022 and 0.81 for 2024 [2][3].
The most striking thing is what is missing. There is no country with a high income and low electricity use. The Hub now calls the chart “The Empty Quadrant” for that reason. On its 2024 data, every country with GDP above $30,000 per person used at least 4,000 kWh of electricity per person a year. A few countries, such as Costa Rica and Romania, reach high income status on under 3,000 kWh, but none gets much further on so little [3].
Does energy use drive economic growth, or the other way round?
Both, and it is hard to separate them. The Energy for Growth Hub is careful to say it is not claiming direct causality. Its view is that higher incomes drive greater energy demand, and energy use can drive higher incomes, especially when it is used outside the home in factories, offices, farms and transport [3].
The everyday version is easy to see. As households get richer they add lighting, fridges, washing machines, air conditioning or heating and eventually cars [4]. On the other side, a business cannot run machinery, cold storage or a data centre without a reliable supply of power. The Hub’s summary is that poor countries cannot get rich without a lot more electricity, and that the relationship can work as a virtuous circle or a poverty trap [3].
Countries that use more or less electricity than their income suggests
Most countries are close to what their income would predict, but the exceptions are informative [2][3]:
- Tajikistan and Mozambique use much more electricity than their incomes would suggest. Both have large, older hydropower schemes that run energy hungry export industries, particularly aluminium smelting.
- Iceland is far above the line for the same reason. It produced 48,424 kWh per person in 2024, most of it used for aluminium smelting and, increasingly, data centres. In effect it exports energy in the form of metal and computing.
- Sierra Leone, Chad, Burundi and Somalia are at the very bottom of both electricity use and income.
The Hub’s reading is simple: countries above the line use more electricity than their income would predict, and countries below it use less [2][3].
The 1,000 kWh Modern Energy Minimum
The chart’s dashed line at 1,000 kWh per person reflects a target the Energy for Growth Hub has been arguing for. The usual international definition of “energy access” is very low. The International Energy Agency’s benchmark for basic access is 10 to 15 kWh per person a year, enough for a few light bulbs, a phone charger and a radio but not for modern appliances [5].
The Hub’s proposed Modern Energy Minimum raises the bar to 1,000 kWh per person a year, with at least 250 kWh used at home and 750 kWh in the wider economy, where most electricity is actually used [5]. For comparison, people in the US used 13,015 kWh each in 2025 [5]. On the 2021 chart, the countries below 1,000 kWh are mostly in sub-Saharan Africa, plus Afghanistan, Haiti, Myanmar, Pakistan and Bangladesh, with India sitting right on the line [1].
The gap between rich and poor is very large. On the Hub’s 2024 data, people in high income countries use 67 times as much electricity as people in low income countries [3].
GDP vs total energy use, not just electricity
People often search for “GDP vs energy consumption”, but this chart measures electricity only. Total energy use also includes oil for transport, gas for heating and fuels burnt directly in industry. Our World in Data’s charts of total energy use per person against GDP show the same broad pattern: at low to middle incomes, energy use rises closely with income [4].
The difference appears at the top. Several rich countries have decoupled growth from energy use, meaning their GDP has kept rising while energy use per person has stayed flat or fallen. Sweden is the clearest example, and the UK, Germany, Denmark and Switzerland have done the same [4]. This is not only because they moved manufacturing abroad: when the energy used to make imported goods is counted, energy use has still levelled off or fallen in many of these countries [4].
So the rule is not that every extra pound or dollar of GDP needs more energy forever. It is that getting from low income to high income has always needed a large increase in energy, and especially electricity, and no country has yet done it without one.
Questions about GDP vs energy consumption
Is there a correlation between GDP and energy consumption?
Yes, a strong one. On the Energy for Growth Hub’s chart, GDP per person explains about 80% of the variation in electricity use per person between countries (R² = 0.8 for 2021, 0.81 for 2024) [1][3].
Are there any rich countries that use little energy?
No. In the Hub’s 2024 data every country with GDP above $30,000 per person used at least 4,000 kWh of electricity per person. Costa Rica and Romania reach high income on under 3,000 kWh, which is as low as it gets [3].
Which country consumes the most energy per capita?
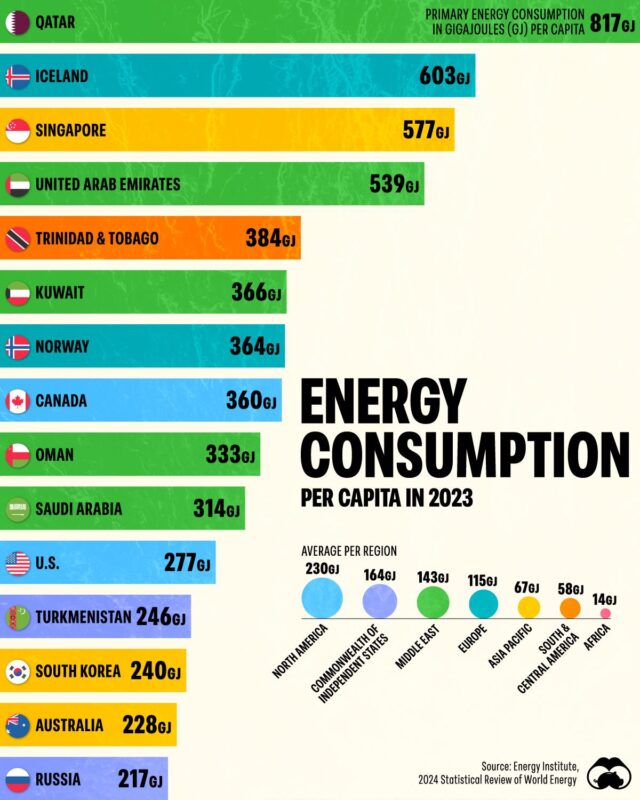
Iceland, because of its aluminium smelters and data centres, along with Canada, the US and Gulf states such as Saudi Arabia and Oman, are among the largest energy users per person, according to Our World in Data [6].
How much more electricity do rich countries use than poor ones?
About 67 times as much per person, comparing high income and low income countries on the Hub’s 2024 data [3]. On its 2022 data the figure was 77 times [2].
Can a country grow its economy without using more energy?
Rich countries can. Sweden, the UK, Germany, Denmark and Switzerland have grown their economies while energy use per person stayed flat or fell [4]. Poorer countries have not managed to reach high incomes without a big rise in energy use [3].
Sources
- Energy for Growth Hub, chart of electricity consumption per capita against GDP per capita, using US Energy Information Administration and World Bank data for 2021 (the graphic on this page).
- Energy for Growth Hub (Todd Moss and Hamna Tariq), High-Income Low-Energy Countries Don’t Exist [Update Sep 2024], 10 September 2024.
- Energy for Growth Hub (Todd Moss and Hamna Tariq), (Re) Introducing The Empty Quadrant, 19 May 2026.
- Our World in Data (Hannah Ritchie), A number of countries have decoupled economic growth from energy use, and the chart Energy use per person vs GDP per capita.
- Energy for Growth Hub, The Modern Energy Minimum.
- Our World in Data, Energy production and consumption.
Last reviewed 7 November 2026