Is the state you live in among the happiest in the U.S. in 2024? This year, happiness is being meticulously quantified across the states using a comprehensive 'Happiness Score.' This score evaluates emotional and physical well-being, work environment, and community and environment, utilizing a scale of 100 grounded in 30 distinctive metrics like life expectancy and ideal weather.
As people yearn for answers about happiness and well-being, understanding how these states rank can provide insights into key trends.
Dive in to discover which states top the happiness charts and the factors that contribute to higher happiness indices in various U.S. regions.
Understanding Happiness by State in 2024
Happiness across U.S. states in 2024 is quantified using a 'Happiness Score,' which evaluates key dimensions such as Emotional & Physical Well-Being, Work Environment, and Community & Environment. This score operates on a scale of 100 and is derived from 30 distinct metrics, each contributing to a comprehensive understanding of happiness.
- Life expectancy
- Ideal weather
- Hours worked
- Income level
- Job satisfaction
- Physical health
- Mental health
- Access to healthcare
- Safety and crime rates
- Educational attainment
- Social support
- Community engagement
- Environmental quality
- Leisure time
- Work-life balance
- Commute time
- Housing affordability
- Cost of living
- Cultural opportunities
- Diversity and inclusion
- Public services quality
- Political stability
- Economic freedom
- Volunteerism rates
- Internet access
- Transportation infrastructure
- Recreational facilities
- Air quality
- Water quality
- Noise pollution
These metrics are crucial in deciphering state happiness trends for 2024. By examining these factors, researchers can identify patterns and disparities in happiness levels across different regions. The integration of diverse metrics allows for a nuanced analysis, helping stakeholders to identify areas needing improvement and fostering environments that enhance overall well-being. The data-driven approach provides insights into how states can strategically enhance their citizens' happiness by focusing on specific areas of improvement.
The Happiest States in America in 2024
Hawaii takes the crown as the happiest state in America for 2024, boasting a Happiness Score of 68.71. Its warm climate and relaxed atmosphere significantly contribute to its top ranking. The island state's stunning natural beauty and vibrant culture also play a crucial role in fostering a sense of well-being among its residents.
Maryland
Maryland ranks high on the happiness scale due to its low unemployment rate and high-paying job opportunities. The state's proximity to Washington, D.C., provides residents with access to a plethora of professional opportunities, enhancing economic stability and overall happiness.
New Jersey
New Jersey's strong job security and robust infrastructure contribute to its high happiness ranking. The state's diverse cultural offerings and excellent educational institutions further enrich the quality of life for its residents, making it a top contender in the happiness rankings.
Utah
Utah excels in the work environment and community categories. Its natural beauty, including national parks and outdoor recreation opportunities, enhances the quality of life. Strong community ties and a focus on family values also play a pivotal role in Utah's happiness score.
Delaware
Delaware benefits from its affordability and scenic coastline. The state's small size fosters a close-knit community feel, and its low cost of living allows residents to enjoy a comfortable lifestyle. These factors combine to make Delaware one of the happiest states in America for 2024.
| State | Happiness Score | Key Factors |
|———-|—————–|————————————–|
| Hawaii | 68.71 | Warm climate, relaxed atmosphere |
| Maryland | — | Low unemployment, high-paying jobs |
| New Jersey | — | Job security, infrastructure |
| Utah | — | Work environment, community ties |
| Delaware | — | Affordability, scenic coastline |
Factors Influencing State Happiness in 2024
What are the main factors influencing happiness by state in 2024?
The primary factors include job security, income growth, and climate. These elements significantly impact the overall well-being of residents, shaping their perceptions of happiness. For instance, job security provides economic stability, reducing stress and enhancing life satisfaction. Income growth translates into better living standards, allowing individuals to afford necessities and luxuries that contribute to a happier lifestyle. Climate, particularly in states like Hawaii, plays a crucial role by offering a pleasant environment that boosts mood and encourages outdoor activities.
- Job security
- Income growth
- Climate
- Community engagement
- Healthcare accessibility
How do these factors vary across different states?
The influences of these factors differ widely among states due to unique economic, environmental, and social conditions. In Maryland, the low unemployment rate of 2.8% and high-paying job opportunities contribute to a high happiness score, as residents enjoy financial security and career prospects. Utah's focus on a positive work environment and strong community ties enhances its residents' sense of belonging and satisfaction. Meanwhile, Hawaii's warm climate remains a consistent source of happiness, allowing for a relaxed lifestyle and outdoor leisure.
These varied influences highlight the complexity of happiness metrics across the United States, with each state leveraging its strengths to improve its citizens' quality of life. Understanding these factors enables policymakers to tailor initiatives that address specific needs, fostering environments where happiness can thrive.
The Role of Economic and Environmental Metrics in State Happiness
Economic stability and environmental factors play a crucial role in determining state happiness levels. States that offer economic prosperity often see higher happiness ratings as they provide residents with financial security and opportunities for growth. Simultaneously, environmental attributes such as climate and natural beauty significantly enhance the quality of life, contributing to overall well-being.
- Hawaii: Warm climate, high cost of living
- Maryland: High-paying jobs, proximity to D.C.
- Utah: Natural beauty, quality of life
- New Jersey: Job security, infrastructure
- Delaware: Affordability, scenic coastline
The interplay between economic and environmental metrics creates varying levels of happiness across states. For instance, Hawaii's high cost of living is offset by its warm climate, which consistently uplifts residents' moods. Maryland benefits from high-paying jobs and its proximity to Washington, D.C., offering robust economic opportunities. Utah leverages its natural beauty to enhance residents' quality of life, while New Jersey provides job security and strong infrastructure to support happiness. Delaware, with its affordability and scenic coastline, offers a balanced lifestyle that appeals to many.
These differences illustrate how states can harness their unique economic and environmental strengths to foster happiness. Understanding these dynamics enables policymakers to address specific challenges and capitalize on opportunities to improve residents' quality of life, ultimately leading to a more content and thriving populace.
Interpreting the 2024 Happiness Map of the United States
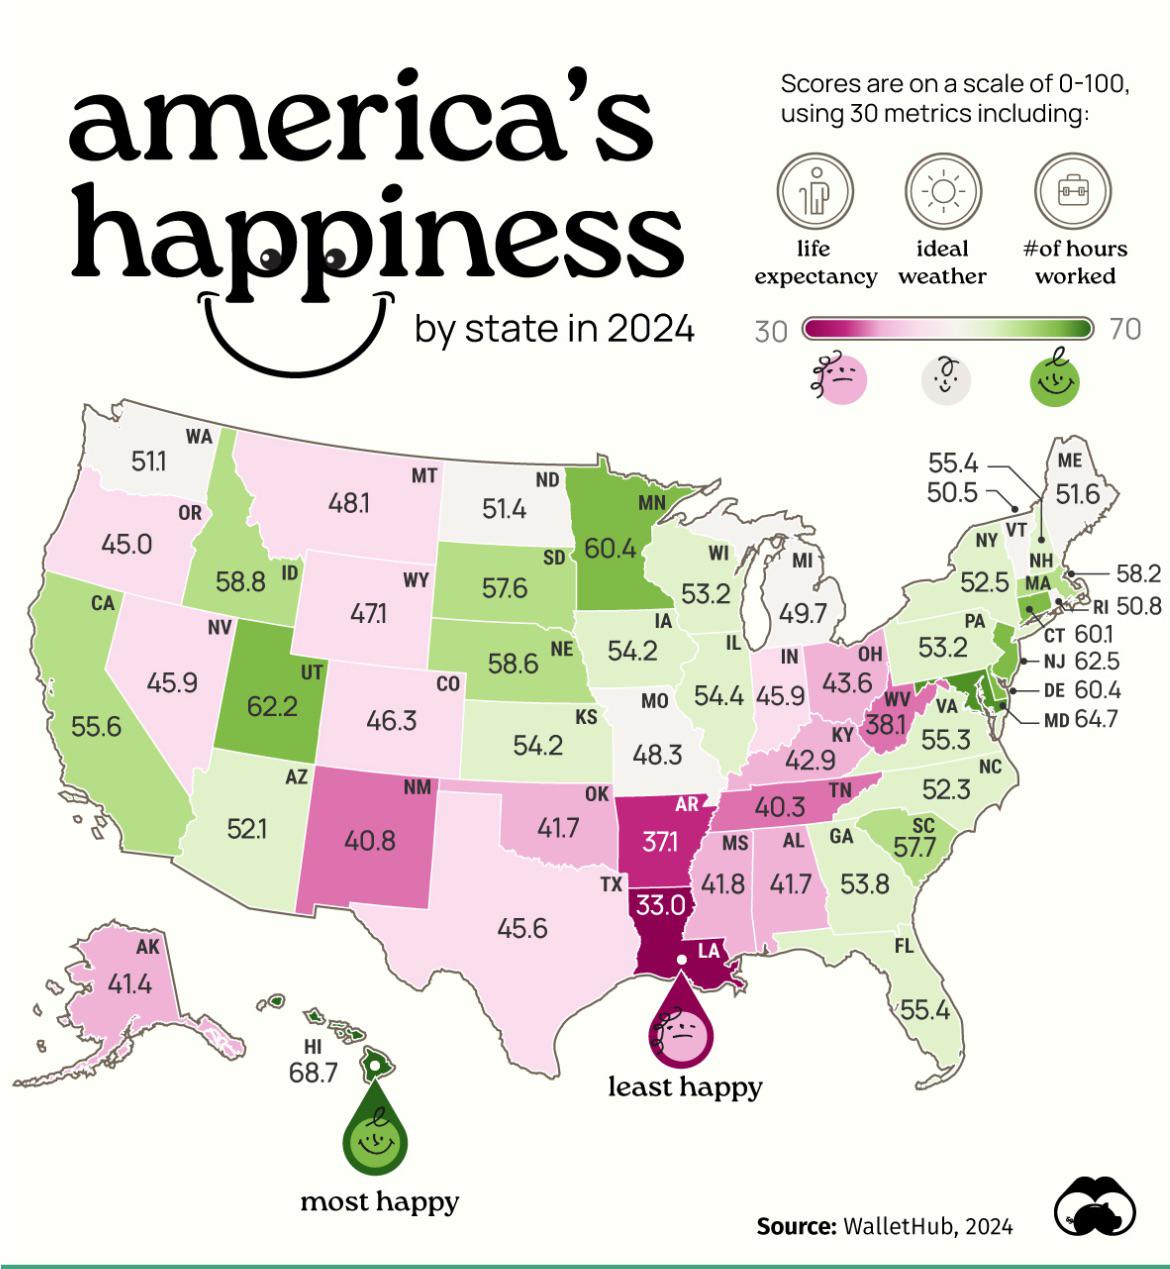
The 2024 happiness map of the United States offers a vivid portrayal of happiness levels across various states through a strategic use of color coding. Darker shades on the map signify higher happiness levels, while lighter shades indicate lower happiness levels. This visual tool is instrumental in highlighting state-by-state comparisons and uncovering regional trends in happiness. By examining the map, one can quickly discern which states are excelling in terms of happiness and which may need targeted interventions to improve the well-being of their residents.
Understanding Map Color Codes
What do the darkest and lightest shades on the map signify? The darkest shades represent states with the highest happiness scores, while the lightest shades indicate the lowest scores. For instance, Hawaii stands out with the darkest shade, boasting the highest happiness score of 68.7. The state's warm climate and relaxed lifestyle contribute significantly to this top ranking. On the other hand, Louisiana is marked by the lightest shade, with the lowest happiness score of 33.0. This contrast highlights the diverse factors affecting happiness across the country, from economic conditions to environmental influences.
| State | Happiness Score | Color Code |
|———–|—————–|————-|
| Hawaii | 68.7 | Darkest |
| Maryland | — | Dark |
| New Jersey| — | Medium |
| Utah | — | Medium |
| Louisiana | 33.0 | Lightest |
This table serves as a quick reference to understand the happiness scores and corresponding color codes for selected states in 2024. The map and table together provide a comprehensive overview of happiness distribution, enabling researchers, policymakers, and the public to interpret and act upon these insights effectively. By focusing on these visual data representations, stakeholders can develop tailored strategies to enhance happiness and address disparities across the nation.
Final Words
Exploring happiness by state in 2024 reveals insightful connections between emotional, physical well-being, and numerous environmental and economic factors.
Highlighting Hawaii with the highest happiness score, and Louisiana at the lowest, demonstrates diverse regional influences on state happiness.
Key factors such as job security, climate, and community engagement were discussed, showcasing their varying impact across states like Maryland and Utah.
Such insights encourage a collective understanding of the happiness landscape, inspiring further pursuit of enhanced well-being.
Adopting these findings, individuals, and policymakers can foster a more content and thriving society in 2024 and beyond.

