How much does a family need to live comfortably in the US?
The figures most people quote come from SmartAsset, which updates its study every year. It takes the MIT Living Wage Calculator’s cost of basic needs for two working adults with two children, treats that as the 50% “needs” part of a 50/30/20 budget, and adds 30% for wants and 20% for savings [2][3]. The result is the pre-tax household income needed to cover essentials, have some money for holidays and hobbies, and save for retirement and emergencies.
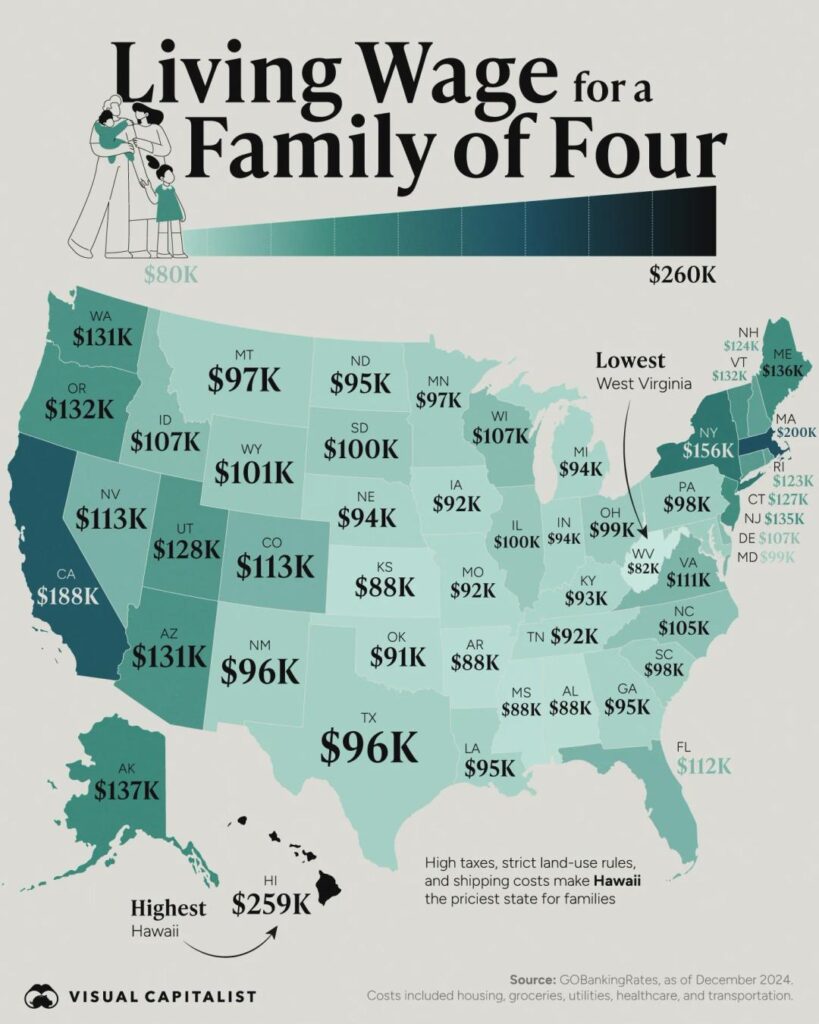
In the 2026 study, using MIT data updated in February 2026, Massachusetts needs the most at $329,555 a year and Mississippi the least at $187,533 [2]. The infographic on this page, by Bruno Venditti of Visual Capitalist, shows the 2024 edition of the same study, when the range was $177,798 in Mississippi to $301,184 in Massachusetts [1][4]. Costs have gone up in every state since then, so use the table below rather than the map for current figures.
Income needed to live comfortably by state in 2026
Pre-tax household income for two working adults with two children, using SmartAsset’s method and MIT’s February 2026 living wage data (our calculation from the MIT state figures, which matches SmartAsset’s published numbers for Massachusetts and Mississippi) [2][3]:
| Rank | State | Income needed |
|---|---|---|
| 1 | Massachusetts | $329,555 |
| 2 | Hawaii | $313,165 |
| 3 | California | $302,682 |
| 4 | Connecticut | $298,189 |
| 5 | New Jersey | $295,110 |
| 6 | New York | $291,533 |
| 7 | Colorado | $283,213 |
| 8 | Washington | $281,798 |
| 9 | Oregon | $280,966 |
| 10 | Vermont | $280,384 |
| 11 | Alaska | $272,064 |
| 12 | New Hampshire | $267,904 |
| 13 | Rhode Island | $264,659 |
| 14 | Minnesota | $263,078 |
| 15 | Maryland | $257,837 |
| 16 | Maine | $250,931 |
| 17 | Montana | $249,434 |
| 18 | Pennsylvania | $247,936 |
| 19 | Illinois | $244,109 |
| 20 | Virginia | $242,944 |
| 21 | Nevada | $242,278 |
| 22 | Indiana | $241,696 |
| 23 | Wisconsin | $238,451 |
| 24 | Arizona | $236,870 |
| 25 | Utah | $235,789 |
| 26 | Delaware | $228,134 |
| 27 | Ohio | $226,221 |
| 28 | Idaho | $226,054 |
| 29 | Florida | $223,392 |
| 30 | New Mexico | $223,142 |
| 31 | Nebraska | $223,059 |
| 32 | Missouri | $217,734 |
| 33 | Georgia | $214,573 |
| 34 | Michigan | $214,323 |
| 35 | South Carolina | $212,909 |
| 36 | North Carolina | $212,410 |
| 37 | Wyoming | $212,410 |
| 38 | Oklahoma | $211,910 |
| 39 | North Dakota | $210,496 |
| 40 | Kansas | $207,917 |
| 41 | Iowa | $204,422 |
| 42 | Texas | $203,424 |
| 43 | West Virginia | $202,592 |
| 44 | South Dakota | $201,760 |
| 45 | Alabama | $198,931 |
| 46 | Louisiana | $197,933 |
| 47 | Tennessee | $197,267 |
| 48 | Arkansas | $195,437 |
| 49 | Kentucky | $194,854 |
| 50 | Mississippi | $187,533 |
Washington, D.C. is not a state, but on the same basis it would rank second, at $319,405 [3]. By our count, all but six states (Alabama, Louisiana, Tennessee, Arkansas, Kentucky and Mississippi) now need more than $200,000.
How the figures have changed since 2024
Between the 2024 study shown on the map and 2026, the income needed rose by $28,371 (9.4%) in Massachusetts and $9,735 (5.5%) in Mississippi, by our sums from SmartAsset’s figures [2][4]. California rose 9.4% to $302,682 and passed $300,000 for the first time. The order has shifted too: New Jersey has moved up from ninth in 2024 to sixth, while New York has dropped from fourth to seventh.
Not every state rose evenly. In SmartAsset’s 2025 study, Hawaii’s family figure fell slightly, by 0.08%, while Vermont’s rose 15.5% and New Jersey’s 12.6% in a single year [5]. Year-to-year changes depend on MIT’s updates to housing, childcare and tax estimates, so treat one year’s jump with some caution.
Why the income needed is so high
The figures look large because they are built on three layers. The MIT living wage covers only basic needs: food, childcare, health care, housing, transport, internet and phone, other essentials, and taxes [3]. For a family of four in Massachusetts that comes to $164,780 a year before tax, with childcare at $41,712 and housing at $30,181 the biggest costs. In Mississippi the same basket costs $93,750, with childcare at $14,162 and housing at $12,645 [3].
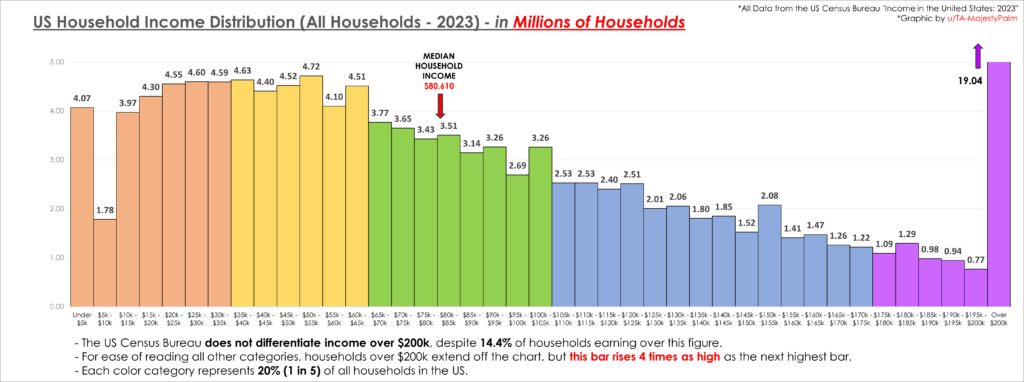
SmartAsset then doubles the living wage, because under the 50/30/20 rule needs should take only half of your income. So a “comfortable” income is exactly twice the cost of basic needs. That is a high bar: the median US household income was $87,460 in 2025, the highest on record [6]. Most families get by on far less than these figures, but they have less left over for savings and less of a cushion when something goes wrong.
Living wage compared with a comfortable income
A living wage is the least a family needs to cover essentials without help. A comfortable income adds room for wants and real savings. In Texas, for example, the 2026 living wage for two working parents with two children is $24.45 an hour each, about $101,712 a year together, while the comfortable figure is $203,424 [3]. If only one parent works, MIT puts the living wage at $37.39 an hour, about $77,771 a year, because the family no longer needs to pay for childcare [3].
Single adults need far less. In the 2026 study a single adult needs $129,002 in Hawaii, the most expensive state, and $81,245 in West Virginia, the cheapest [2].
What the averages hide
State figures are averages. Costs inside a state vary a lot: Boston costs far more than western Massachusetts, and the same goes for the Bay Area against rural California. MIT publishes county and metro figures, so if you are planning a move it is worth looking up the county rather than the state [3]. The figures also assume two children in childcare and pre-tax income; a family with older children, cheaper housing or a paid-off home needs much less.
Questions about the income a family needs to live comfortably in the US
How much money does a family of 4 need to live comfortably?
Between $187,533 a year in Mississippi and $329,555 in Massachusetts, on SmartAsset’s 2026 figures for two working adults with two children [2]. Most states fall between $200,000 and $250,000.
What state needs the lowest income for a family to live comfortably?
Mississippi, at $187,533 in 2026, followed by Kentucky and Arkansas, both about $195,000 [2][3].
What is considered living comfortably?
In SmartAsset’s study it means earning enough to follow the 50/30/20 rule: 50% of income on needs, 30% on wants and 20% on savings or paying off debt [2]. It is a budgeting benchmark, not an official measure.
Is $100,000 a good salary for a family of 4?
It covers basic needs in most states. In 2026 the MIT living wage for two working parents with two children is below $100,000 in states such as Mississippi, Arkansas and Kentucky, and around $101,000 to $102,000 in Texas and West Virginia [3]. It is well short of the comfortable figure everywhere.
How much do you need to live comfortably as a single person?
Between $81,245 in West Virginia and $129,002 in Hawaii in 2026 [2].
Sources
- Bruno Venditti, Mapped: The Income a Family Needs to Live Comfortably in Every U.S. State, Visual Capitalist, May 2024.
- SmartAsset, Here’s the Salary It Takes to Live Comfortably in Each U.S. State in 2026.
- MIT Living Wage Calculator, state living wage tables, updated 15 February 2026.
- SmartAsset, Salary Needed to Live Comfortably in Every U.S. State, 2024 study.
- SmartAsset, Salary Needed to Live Comfortably, 2025 study.
- US Census Bureau, Income in the United States: 2025, September 2026.
Last reviewed 7 November 2026