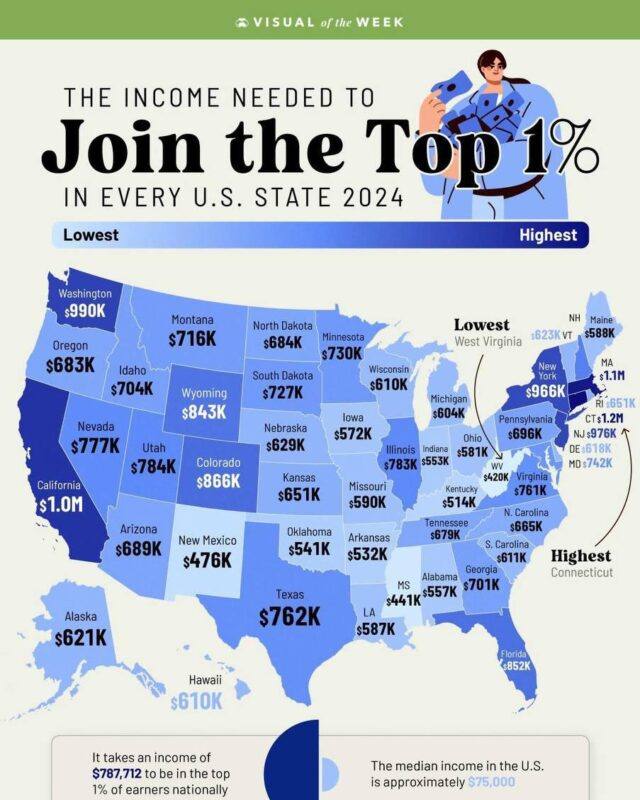
How much is a living wage for a family of four in each state?
A living wage for a family of four in the US ranges from about $82,000 a year in West Virginia to $259,000 in Hawaii, according to a GOBankingRates study from December 2024. In 26 states a family of two adults and two children needs $100,000 or more, and the average across the country is about $121,000. Massachusetts ($200,000) and California ($188,000) are the next most expensive states.
The living wage infographic by Visual Capitalist maps those figures state by state [1]. This article explains what the number includes, why it is so much higher in some states, and how it compares with the better known MIT Living Wage Calculator, which counts things differently and often gives a very different answer [2][3].
Living wage for a family of four by state
Hawaii, Massachusetts, California and New York need the highest incomes, and West Virginia, Mississippi, Alabama, Kansas and Arkansas the lowest. The table gives every state’s figure from the GOBankingRates study, with its yearly cost of housing and groceries, highest first [2].
| Rank | State | Living wage, family of four (per year) | Housing (per year) | Groceries (per year) |
|---|---|---|---|---|
| 1 | Hawaii | $258,918 | $66,412 | $28,290 |
| 2 | Massachusetts | $199,671 | $49,600 | $21,129 |
| 3 | California | $188,269 | $45,891 | $19,549 |
| 4 | New York | $155,738 | $37,354 | $15,912 |
| 5 | Alaska | $136,990 | $25,854 | $11,013 |
| 6 | Maine | $135,943 | $29,804 | $12,696 |
| 7 | New Jersey | $134,990 | $30,331 | $12,920 |
| 8 | Vermont | $131,996 | $29,211 | $12,444 |
| 9 | Oregon | $131,824 | $28,904 | $12,313 |
| 10 | Arizona | $131,102 | $29,848 | $12,715 |
| 11 | Washington | $131,024 | $27,807 | $11,845 |
| 12 | Utah | $128,484 | $28,465 | $12,126 |
| 13 | Connecticut | $126,753 | $25,722 | $10,957 |
| 14 | New Hampshire | $123,863 | $25,502 | $10,864 |
| 15 | Rhode Island | $123,298 | $25,107 | $10,695 |
| 16 | Nevada | $112,965 | $23,439 | $9,985 |
| 17 | Colorado | $112,828 | $23,615 | $10,060 |
| 18 | Florida | $112,401 | $23,637 | $10,069 |
| 19 | Virginia | $111,303 | $22,781 | $9,704 |
| 20 | Idaho | $107,412 | $21,749 | $9,265 |
| 21 | Wisconsin | $107,324 | $21,618 | $9,209 |
| 22 | Delaware | $107,042 | $21,179 | $9,022 |
| 23 | North Carolina | $104,582 | $20,981 | $8,938 |
| 24 | Wyoming | $100,750 | $19,774 | $8,423 |
| 25 | Illinois | $100,332 | $18,479 | $7,872 |
| 26 | South Dakota | $100,000 | $19,686 | $8,386 |
| 27 | Ohio | $99,453 | $19,226 | $8,190 |
| 28 | Maryland | $98,585 | $18,040 | $7,685 |
| 29 | Pennsylvania | $98,427 | $18,326 | $7,806 |
| 30 | South Carolina | $98,082 | $18,962 | $8,078 |
| 31 | Montana | $96,870 | $18,567 | $7,909 |
| 32 | Minnesota | $96,640 | $17,623 | $7,507 |
| 33 | New Mexico | $96,130 | $18,633 | $7,937 |
| 34 | Texas | $95,763 | $17,843 | $7,601 |
| 35 | Louisiana | $95,480 | $18,523 | $7,891 |
| 36 | North Dakota | $94,752 | $17,514 | $7,461 |
| 37 | Georgia | $94,682 | $17,382 | $7,404 |
| 38 | Nebraska | $94,102 | $17,448 | $7,432 |
| 39 | Michigan | $93,807 | $17,228 | $7,339 |
| 40 | Indiana | $93,544 | $16,965 | $7,227 |
| 41 | Kentucky | $93,349 | $17,075 | $7,274 |
| 42 | Tennessee | $92,179 | $18,172 | $7,741 |
| 43 | Missouri | $91,669 | $17,250 | $7,348 |
| 44 | Iowa | $91,667 | $16,548 | $7,049 |
| 45 | Oklahoma | $90,659 | $16,394 | $6,984 |
| 46 | Arkansas | $88,312 | $16,504 | $7,030 |
| 47 | Kansas | $87,944 | $15,517 | $6,610 |
| 48 | Alabama | $87,607 | $15,670 | $6,675 |
| 49 | Mississippi | $87,564 | $15,846 | $6,750 |
| 50 | West Virginia | $82,338 | $13,454 | $5,731 |
Washington, D.C. is not included in the study. All figures are as of 11 December 2024 [2].
What the living wage includes
In this study the living wage is the income that covers five necessities with room to spare. GOBankingRates added up a family’s yearly spending on housing, groceries, utilities, healthcare and transportation, then doubled it [2].
The doubling comes from the 50/30/20 budget rule, which puts 50% of take home income on necessities, 30% on everything else and 20% into savings. The starting point is the Bureau of Labor Statistics Consumer Expenditure Survey for 2023, using married couples with children whose oldest child is aged 6 to 17 [2][4]. Each state’s costs were then adjusted with the Missouri Economic Research and Information Center cost of living index for the third quarter of 2024 [2].
So this is a comfortable budget, not a bare minimum. It assumes a family saves a fifth of its income and has money for holidays, eating out and other extras. It does not list childcare or taxes as separate costs, and those two can be large for a family with young children.
Why Hawaii, Massachusetts and California cost the most
Housing explains most of the gap. GOBankingRates puts a Hawaii family’s housing at $66,412 a year, against $13,454 in West Virginia, nearly five times as much [2]. Groceries follow the same pattern, at $28,290 a year in Hawaii and $5,731 in West Virginia.
Visual Capitalist points to high taxes, strict land use rules and the cost of shipping goods to the islands as the reasons Hawaii is the most expensive state for families [1]. Massachusetts and California have the next highest housing costs in the study, at $49,600 and $45,891 a year [2]. Healthcare varies far less between states. It ranges from about $6,500 to $11,300 a year, with Alaska the highest [2].
The cheaper states are mostly in the South and Midwest, where most figures sit between $88,000 and $100,000. The Mountain West is a mixed picture, with Utah ($128,484) and Arizona ($131,102) close to the Northeast while Montana and Wyoming stay under about $101,000 [2].
The MIT Living Wage Calculator gives different figures
The MIT Living Wage Calculator is the most widely used alternative, and it measures a bare minimum rather than a comfortable budget. It costs food, childcare, medical care, housing, transport, broadband and phone, other essentials and taxes, but includes no savings or extras [3].
For two working adults with two children, MIT puts the income needed before tax at $156,562 a year in Hawaii, $164,780 in Massachusetts and $101,311 in West Virginia, using data updated on 15 February 2026 [3]. That is lower than GOBankingRates for Hawaii and Massachusetts but higher for West Virginia, mainly because MIT adds childcare (about $19,300 a year in West Virginia and $41,700 in Massachusetts for two children) and tax [3].
MIT also gives the figure as an hourly wage. In West Virginia each of the two parents needs to earn $24.35 an hour working full time, against a state minimum wage of $8.75. In Hawaii it is $37.64 an hour against a minimum of $16.00 [3]. So which figure is right depends on the question. MIT tells you the least a family can get by on, and GOBankingRates what it takes to live comfortably and save.
How to use these figures
Treat a state figure as a rough guide, not a target for your own family. Costs vary a lot within a state. Housing in a big city can cost twice as much as in a rural county, and the MIT calculator gives figures for each county and metro area if you want something closer to home [3].
The figures also date quickly. These are December 2024 prices, and rents, food and insurance have kept rising since. If you are comparing job offers or thinking about moving, check current rents in the area you are looking at and add your own childcare costs, which neither headline figure fits to your family.
Questions about the living wage for a family of four
What is a living wage for a family of four in 2025?
The GOBankingRates study, published for 2025, puts it between $82,338 a year in West Virginia and $258,918 in Hawaii, with a national average of about $121,000 [1][2]. The MIT calculator gives lower figures for Hawaii and Massachusetts and a higher one for West Virginia, because it counts only basic needs but includes childcare and tax [3].
Which state has the lowest living wage for a family of four?
West Virginia, at $82,338 a year, less than a third of the Hawaii figure. Mississippi, Alabama, Kansas and Arkansas are all close to $88,000 [2].
In how many states does a family of four need six figures?
26, from South Dakota at exactly $100,000 up to Hawaii [2].
Is a living wage the same as the minimum wage?
No. The minimum wage is the legal lowest hourly pay, which is $7.25 at federal level and higher in many states. A living wage is an estimate of what a household actually needs to cover its costs, and for a family it is usually far above the minimum wage [3].
How is the living wage calculated?
There is no single official method. GOBankingRates doubles the cost of five necessities using the 50/30/20 rule [2]. MIT adds up basic costs, including childcare and tax, with no allowance for savings [3].
Sources
- Visual Capitalist, Mapped: The Living Wage for a Family of Four, by State, January 2025. The original page for the infographic.
- GOBankingRates, The Living Wage a Family of Four Needs in All 50 States, data as of 11 December 2024, with methodology.
- Massachusetts Institute of Technology, Living Wage Calculator, data updated 15 February 2026, state pages for Hawaii, Massachusetts and West Virginia.
- US Bureau of Labor Statistics, Consumer Expenditure Surveys, 2023 annual data release.
Last reviewed 13 November 2026