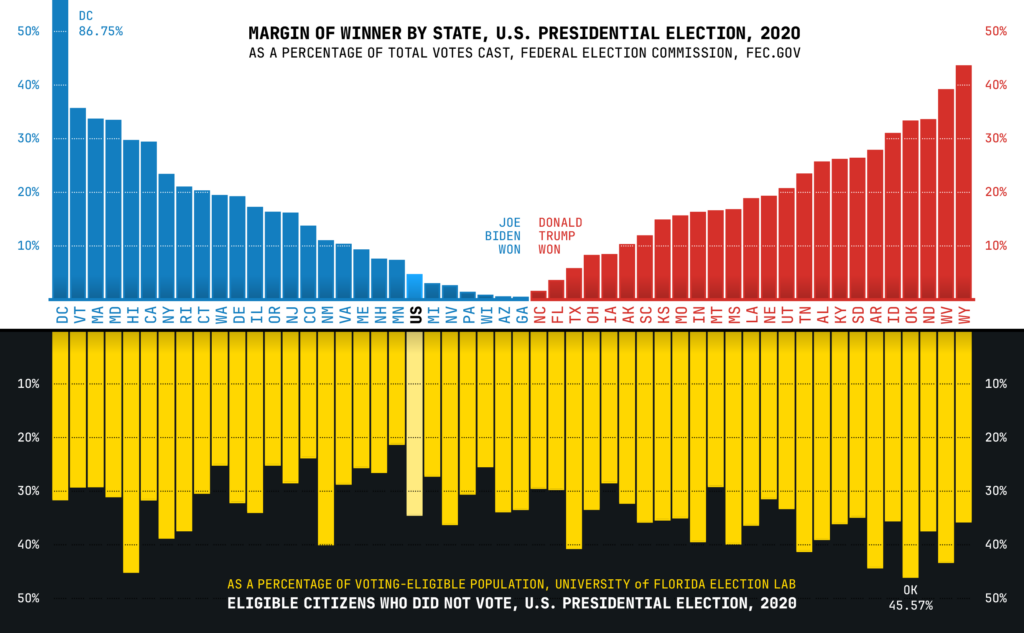
If you count everyone who was eligible to vote, not voting has been the most common result in almost every US presidential election since 1976. Between 34% and 48% of eligible Americans stayed home each time, and no winner has received more than about 34% of the eligible population. 2020 was the only year a candidate, Joe Biden, edged ahead of non-voters.
What presidential election results look like when non-voters are included
Normal election results are shares of the votes cast, so a candidate who wins 51% of the popular vote sounds like the choice of most Americans. Once you add the people who were eligible but did not vote, the picture changes. In most elections the winner was backed by a little over a quarter of eligible adults, and the group that did not vote at all was bigger than either candidate’s support.
The infographic by ptrdo, first posted to r/dataisbeautiful in August 2024, shows this for every election from 1976 to 2020 [1]. The creator took vote totals from the Federal Election Commission [2] and the number of eligible voters from turnout rates published by the University of Florida Election Lab [3], then treated “did not vote” as a result alongside the candidates. Candidates under 3% of the eligible population were left out to keep it readable, which is why some years do not add up to 100% [1].
The table below uses the Election Lab’s current national turnout series [4] and each winner’s share of the popular vote [6] to give the same view for every election from 1976 to 2024. The winner’s share of eligible voters is the popular vote share multiplied by turnout, so treat it as an approximation to the nearest whole number.
| Election | Winner | Turnout of eligible voters | Did not vote | Winner’s share of all eligible voters |
|---|---|---|---|---|
| 2024 | Donald Trump | 64.3% | 35.7% | About 32% |
| 2020 | Joe Biden | 66.4% | 33.6% | About 34% |
| 2016 | Donald Trump | 60.1% | 39.9% | About 28% |
| 2012 | Barack Obama | 58.6% | 41.4% | About 30% |
| 2008 | Barack Obama | 61.6% | 38.4% | About 33% |
| 2004 | George W. Bush | 60.1% | 39.9% | About 30% |
| 2000 | George W. Bush | 54.2% | 45.8% | About 26% |
| 1996 | Bill Clinton | 51.7% | 48.3% | About 25% |
| 1992 | Bill Clinton | 58.1% | 41.9% | About 25% |
| 1988 | George H. W. Bush | 52.8% | 47.2% | About 28% |
| 1984 | Ronald Reagan | 55.2% | 44.8% | About 32% |
| 1980 | Ronald Reagan | 54.2% | 45.8% | About 28% |
| 1976 | Jimmy Carter | 54.8% | 45.2% | About 27% |
Most of these match the infographic to within a point. The two that differ are 1980 and 1984, where the graphic shows 47% not voting. The Election Lab’s current figures put non-voting at about 46% in 1980 and about 45% in 1984, and Reagan’s 1984 landslide works out at about 32% of eligible voters rather than the 31% on the graphic [4]. Turnout estimates for older elections get revised as better population data comes in, so small differences like this are normal.
Who counts as an eligible voter
An eligible voter is a US citizen aged 18 or over who is not barred from voting by state felony laws. This is called the voting-eligible population, or VEP. The Election Lab builds it by taking everyone aged 18 and over living in the US, then removing non-citizens and people who are ineligible because of a felony conviction, and adding eligible citizens living overseas [5].
This matters because turnout figures you see quoted can use different bases. The American Presidency Project shows 2024 turnout as 57.8% of the voting-age population and 63.1% of the voting-eligible population [7], while the Election Lab gives 64.3% of the voting-eligible population, using total ballots counted rather than votes for president [5]. The US Census Bureau’s survey gives a higher 65.3% of the citizen voting-age population, because it relies on people reporting whether they voted [8]. All of them agree on the main point, which is that roughly a third of eligible Americans did not vote in 2024.
How many people did not vote in 2024?
About 87 million eligible Americans did not vote in the 2024 presidential election. The Election Lab estimates a voting-eligible population of 243.8 million and 156.8 million ballots counted, a turnout of 64.3% [5]. That leaves 35.7% of eligible voters at home.
Donald Trump won the popular vote with 49.8% of the votes cast and Kamala Harris took 48.3% [6]. As shares of everyone eligible, that is about 32% for Trump and about 31% for Harris, so not voting was again the largest single result. 2024 turnout was the second highest since 1900, behind only 2020 at 66.4% [4].
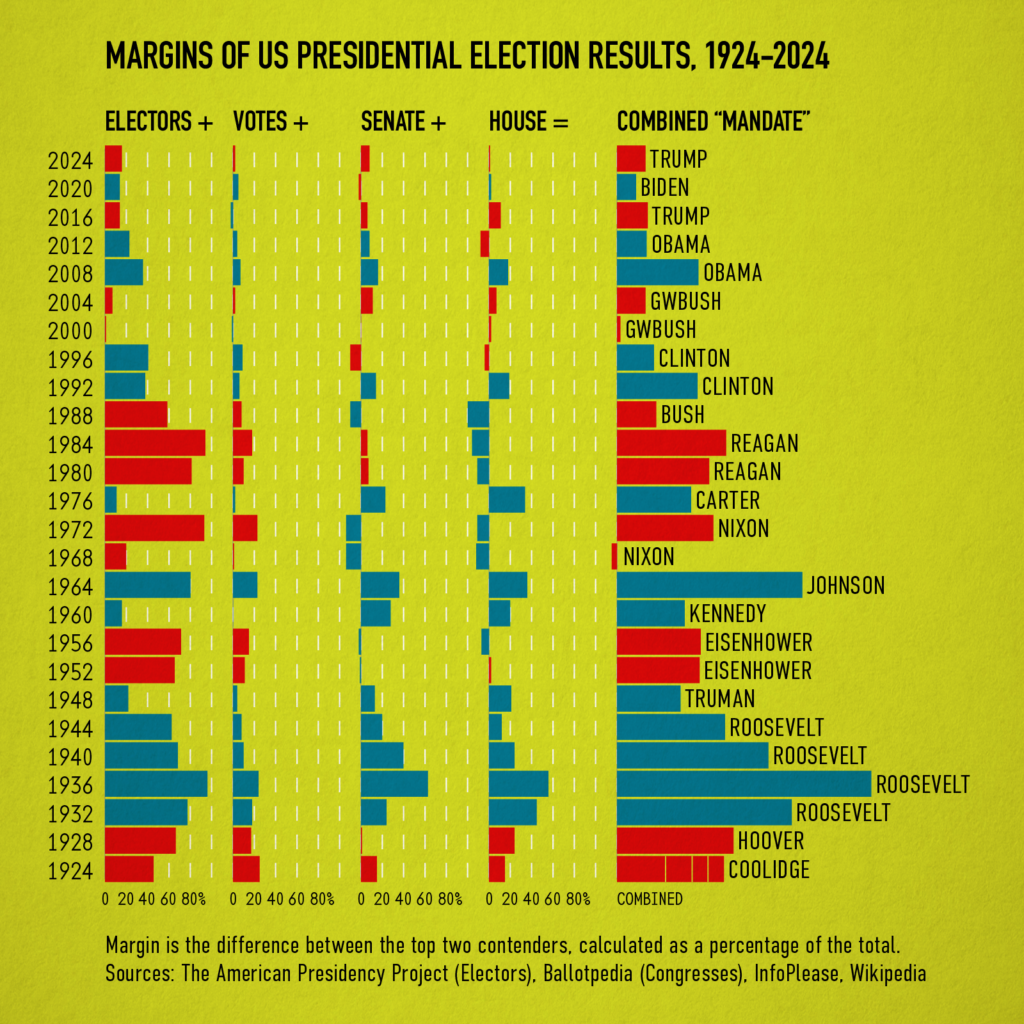
For a breakdown of how the 2020 vote split by group, see our page on 2020 US presidential election voting data. For winning margins and mandates rather than turnout, see US presidential election results analysis.
Which election had the lowest turnout since 1976?
1996 had the lowest turnout of any presidential election since 1976, at 51.7% of eligible voters [4]. That means 48.3% did not vote. Bill Clinton was re-elected with 49.2% of the votes cast, which is only about a quarter of all eligible voters, and Bob Dole had about 21% [1][6].
1988 came close, at 52.8% turnout. Both were won by clear margins of around 8 points [6], and the American Presidency Project notes that research generally finds turnout rises when an election looks close or the stakes seem high [7].
When a candidate wins with fewer votes
Twice since 1976 the winner of the Electoral College lost the popular vote. In 2000 Al Gore won about 26.2% of eligible voters to George W. Bush’s 26.0%, and in 2016 Hillary Clinton had about 29% to Donald Trump’s 28% [1]. In both years the number of people who did not vote (about 46% and 40%) was far larger than the gap between the two candidates.
This is the main reason people find the non-voter view useful. A shift of a few percentage points among people who stayed home would have been enough to change the outcome in either election. It does not tell you how non-voters would have voted, though, and that is a separate question.
Would non-voters have changed the result?
Probably not by much, based on recent research. Pew Research Center matched its survey panel to official voter records and found that neither candidate had a clear edge among people who did not vote in 2024, unlike 2020 when non-voters leaned towards Biden [9]. Among people who did not vote in 2020 but were adults by 2024, 14% went on to vote for Trump and 12% for Harris [9].
Pew also found that about a quarter of eligible adults did something different in 2024 than in 2020. They switched candidate, voted after sitting out 2020, or stayed home after voting in 2020 [9]. So the non-voting group is not a fixed block of people. It changes from one election to the next, which is part of why it is so hard to predict.
Why US turnout rose after 2016
Turnout jumped from 60.1% in 2016 to 66.4% in 2020, the highest since 1900, and stayed high at 64.3% in 2024 [4]. 2020 saw a large expansion of postal and early voting during the pandemic, and the Census Bureau found that in 2024 only 39.6% of voters cast their ballot in person on Election Day, with 30.7% voting early in person and 29.0% by post [8].
Turnout also varies a lot by group. The Census Bureau reports that 82.5% of people with an advanced degree voted in 2024, compared with 52.5% of high school graduates, and women voted at a higher rate than men (66.9% against 63.7%) [8].
Questions about presidential election results including non-voters
What percentage of eligible voters did not vote in 2020?
About 33.6% of eligible voters did not vote in 2020, according to the University of Florida Election Lab’s turnout rate of 66.4% [4]. The infographic shows 33%, based on an earlier estimate of 65.99% turnout that the creator used, which works out at about 78 million people [1]. 2020 is the only election since 1976 where a candidate (Biden, at about 34% of eligible voters) received more support than the share who stayed home.
Did more people not vote than voted for the winner in 2024?
Yes. About 35.7% of eligible Americans did not vote in 2024 [5], while Donald Trump’s 49.8% of the popular vote [6] equals about 32% of eligible voters. Not voting was the largest result in 2024, as it was in every election from 1976 to 2016.
What was voter turnout in the 2024 presidential election?
Turnout in 2024 was 64.3% of the voting-eligible population, with about 156.8 million ballots counted, according to the University of Florida Election Lab [5]. The Census Bureau’s survey puts it at 65.3% of the citizen voting-age population [8]. Either way it was the second highest turnout since 1900.
Has any president won a majority of all eligible voters?
No president since at least 1976 has come close. The highest share of eligible voters in that time was Joe Biden’s, at about 34% in 2020, followed by Barack Obama in 2008 and Ronald Reagan in 1984 at about 33% and 32% [1][4].
Where does turnout data come from?
Official vote totals come from state election officials and are compiled by the Federal Election Commission [2]. Turnout rates for eligible voters are estimated by the University of Florida Election Lab, run by Michael McDonald, which publishes national figures back to 1789 [4]. The Census Bureau’s Current Population Survey adds survey-based turnout broken down by age, education and other groups [8].
Sources
- ptrdo, The Influence of Non-Voters in U.S. Presidential Elections, 1976-2020, r/dataisbeautiful, August 2024, including the creator’s method comment.
- Federal Election Commission, Election results and voting information.
- University of Florida Election Lab, Voter Turnout.
- University of Florida Election Lab, National VEP Turnout Rates, 1789 to present (v1.4).
- University of Florida Election Lab, 2024 General Election Turnout, estimates as of 2 March 2026.
- Wikipedia, List of United States presidential elections by popular vote margin.
- The American Presidency Project, UC Santa Barbara, Voter Turnout in Presidential Elections.
- US Census Bureau, 2024 Presidential Election Voting and Registration Tables Now Available, 30 April 2025.
- Pew Research Center, Behind Trump’s 2024 Victory, a More Racially and Ethnically Diverse Voter Coalition, 26 June 2025.
Last reviewed 15 November 2026