Food and Drink
Food Waste Statistics in the EU
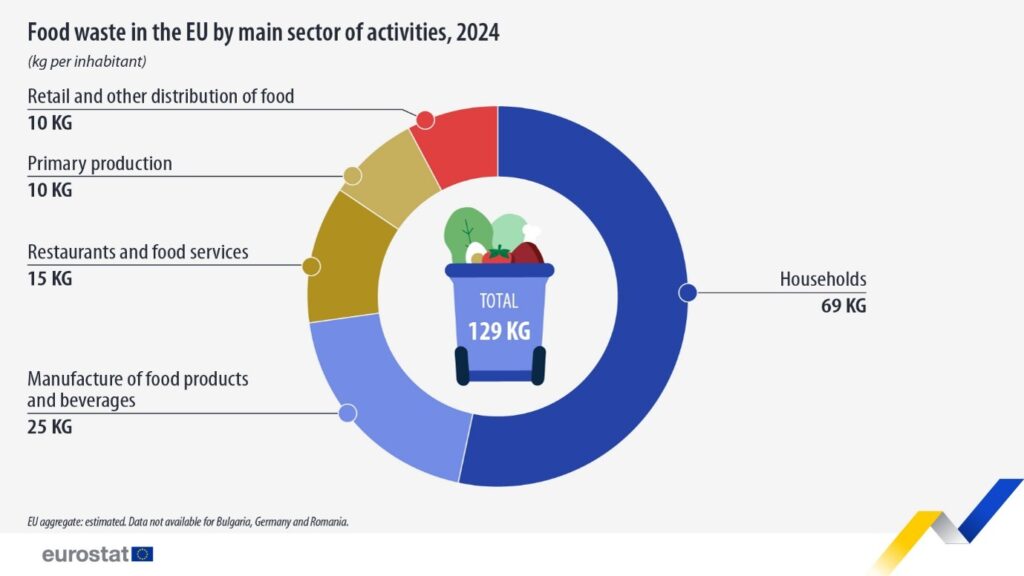
Eurostat's latest figures, for 2024, show that households cause more than half of it (69 kg each), with the rest spread across food factories, restaurants,…
489 reviewed infographics. Search them, or narrow the list by topic or type and sort it the way you want.
Eurostat's latest figures, for 2024, show that households cause more than half of it (69 kg each), with the rest spread across food factories, restaurants,…
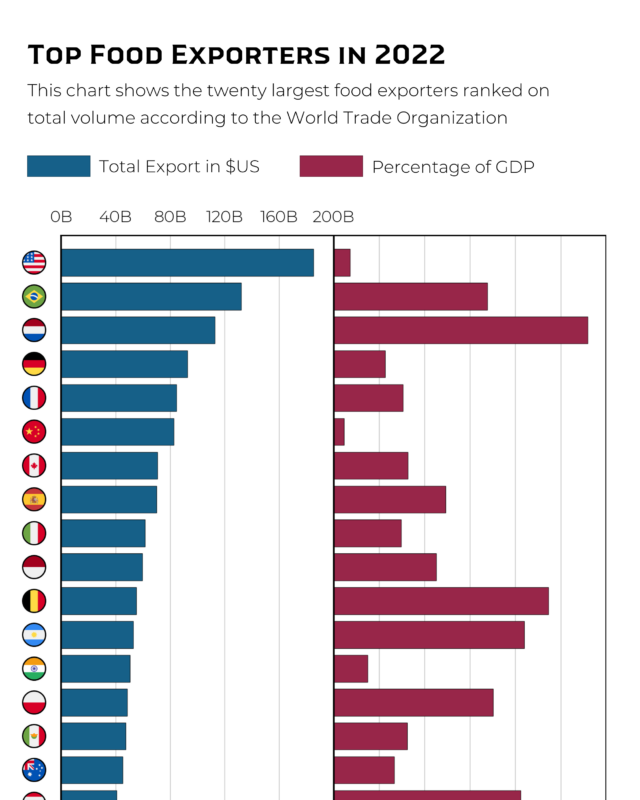
Relative to the size of its economy, the Netherlands depends on food exports most, at about 11% of GDP.

The 10 most popular Thai dishes on this guide by Siamais, a Thai restaurant in Birmingham, are pad thai, tom yum goong, yellow, red and green curry, khao…
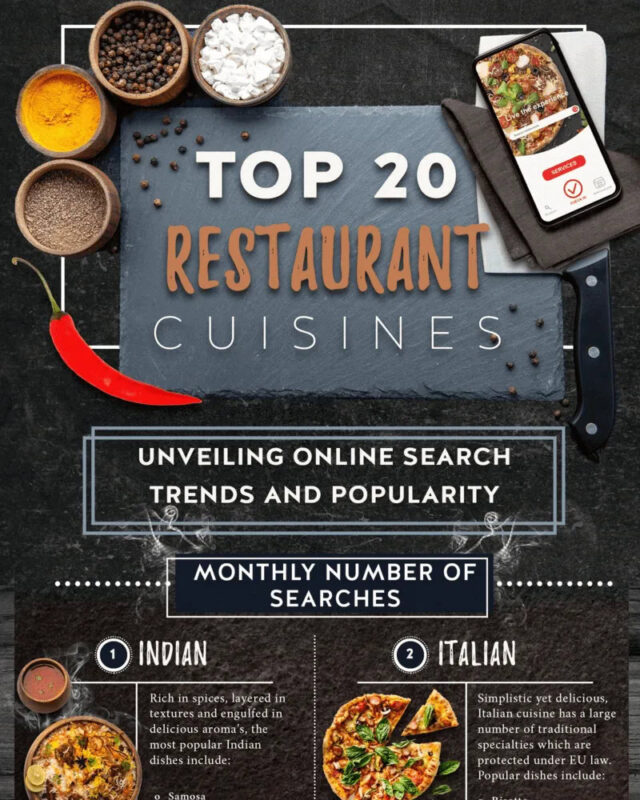
Indian leads with 1,625,160 searches, followed by Italian with 1,392,070 and Chinese with 850,390.
Every topic page starts with a short guide to the subject.