
Education and Learning
Good infographic examples from the 476 on our site, grouped by type. Open any of them to see the data written out in full.
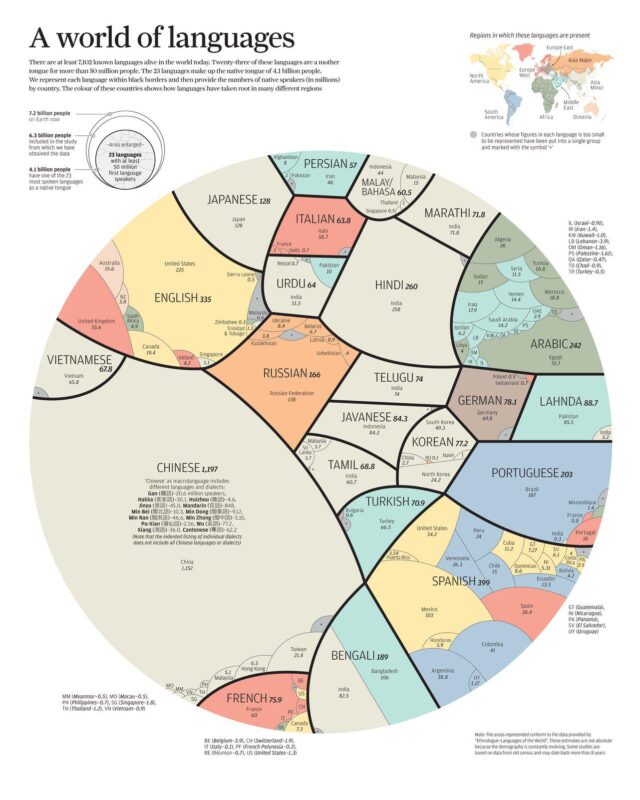
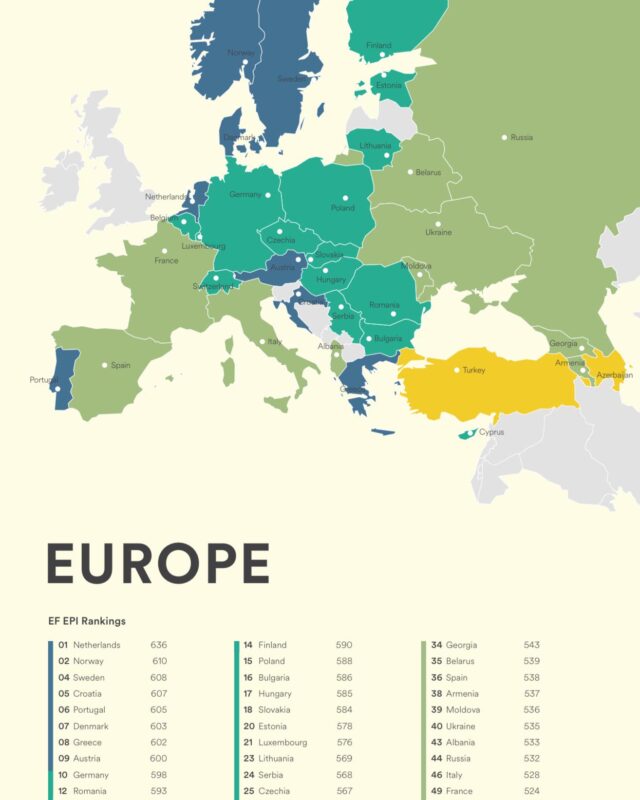
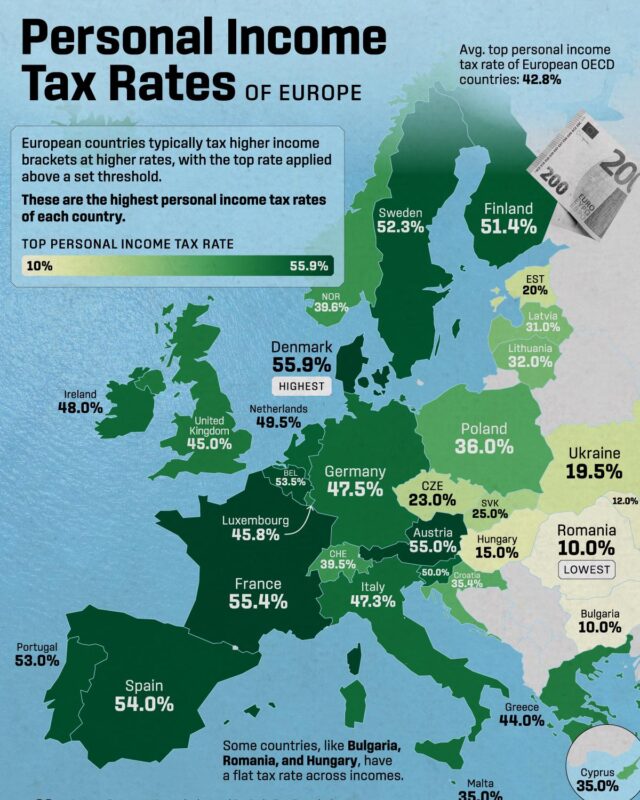
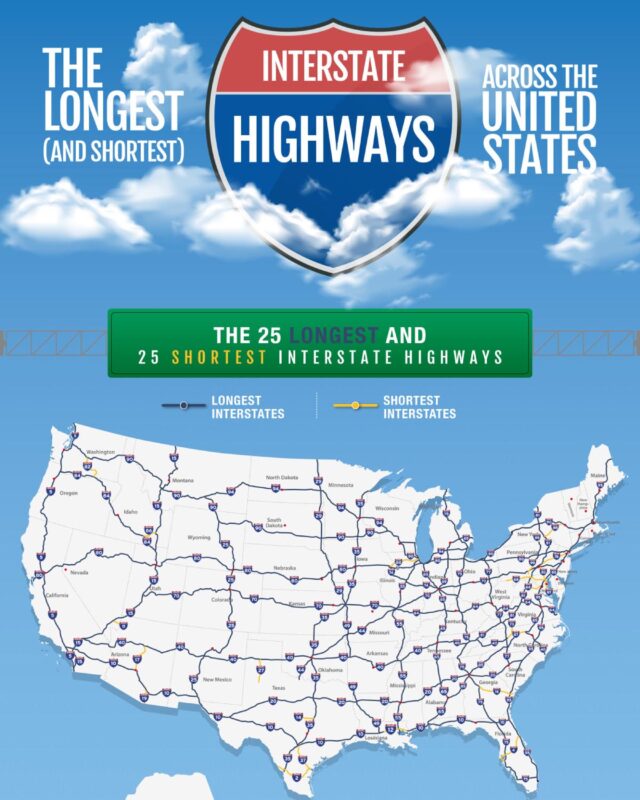
Data laid over a map, so you can compare places at a glance: countries, states, cities or routes.
88 examples




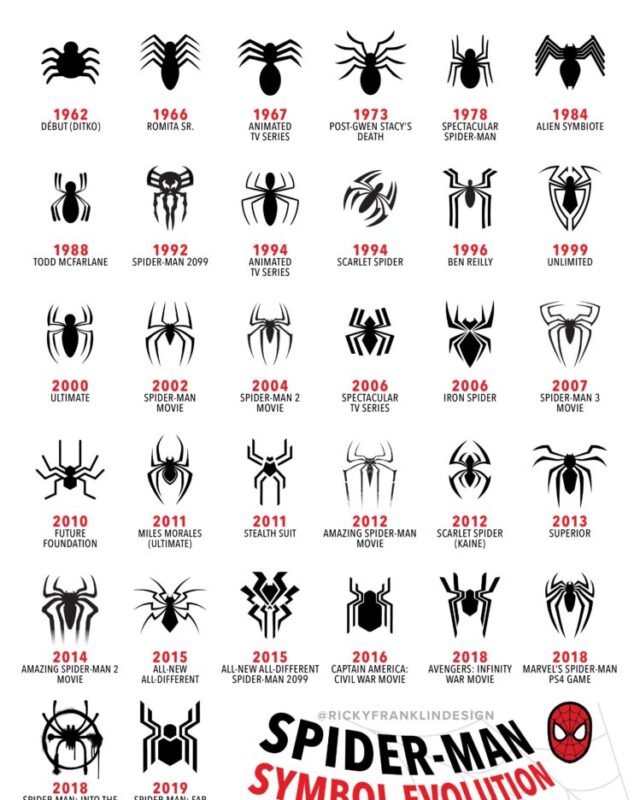
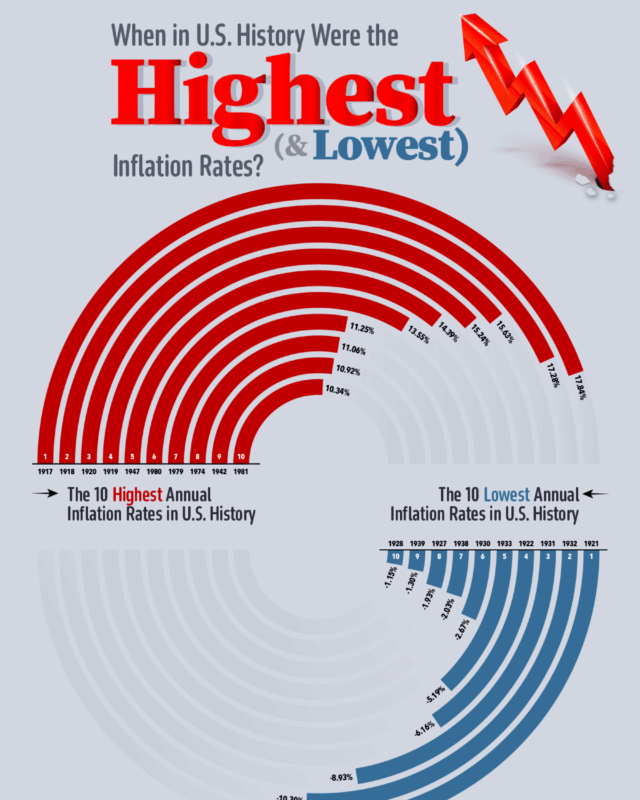
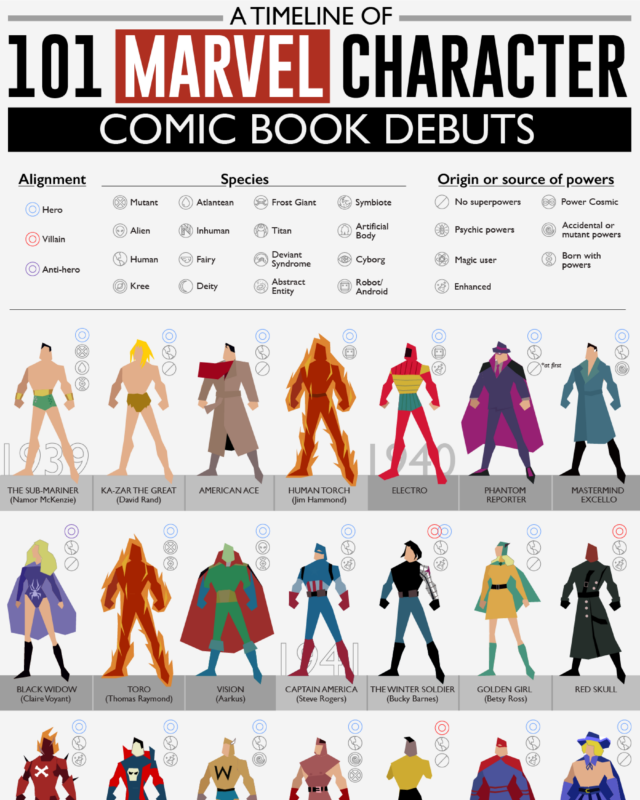
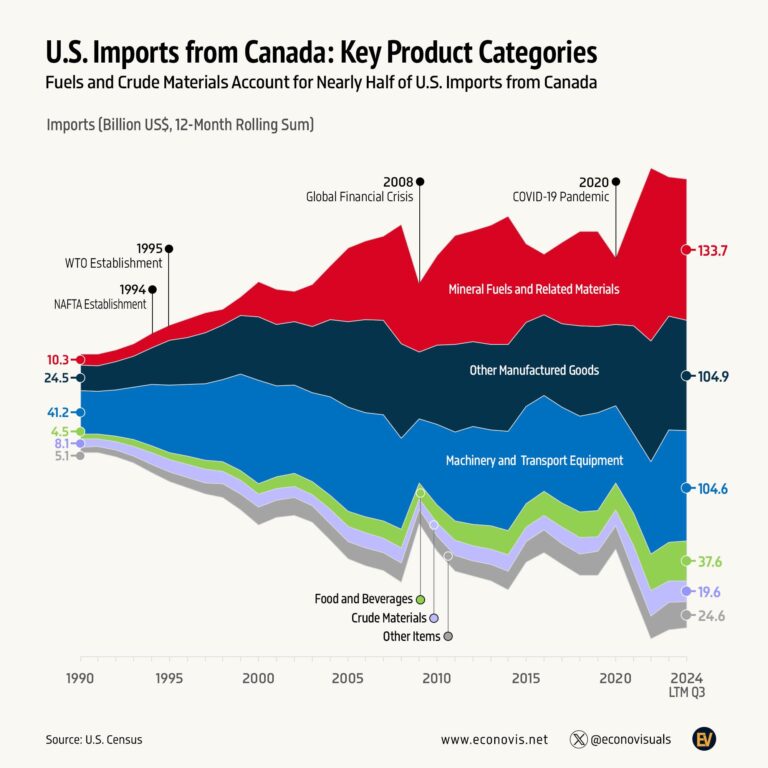
Events or changes set out in date order, so you can see how something developed over years or centuries.
76 examples




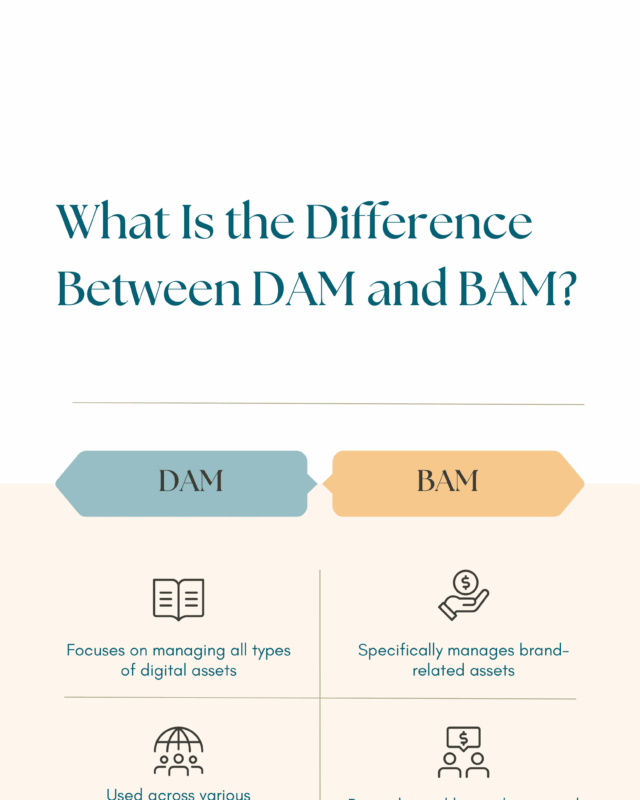
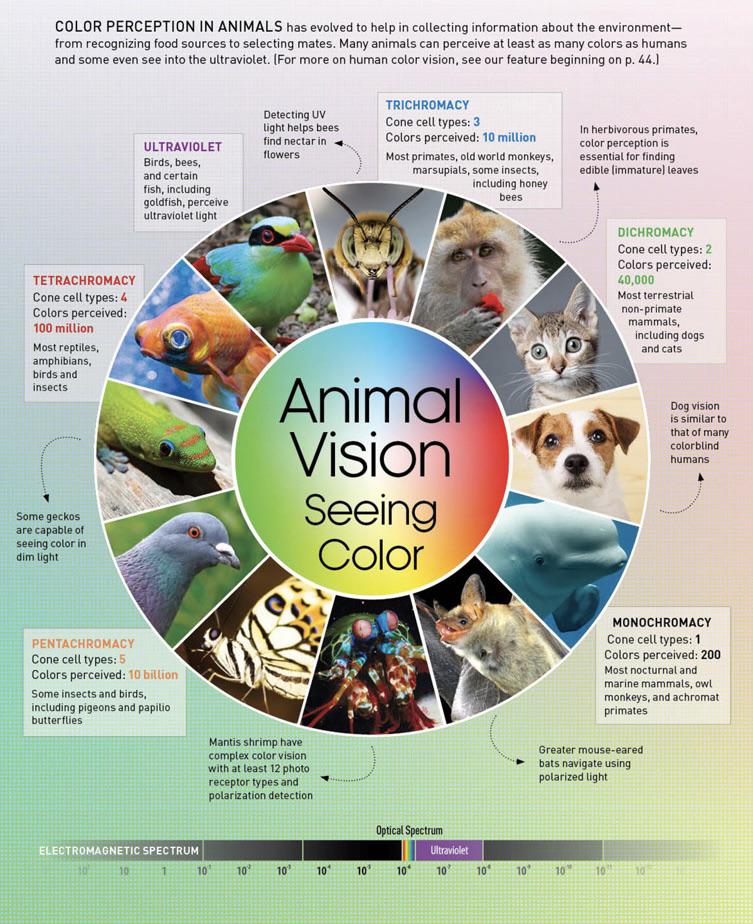
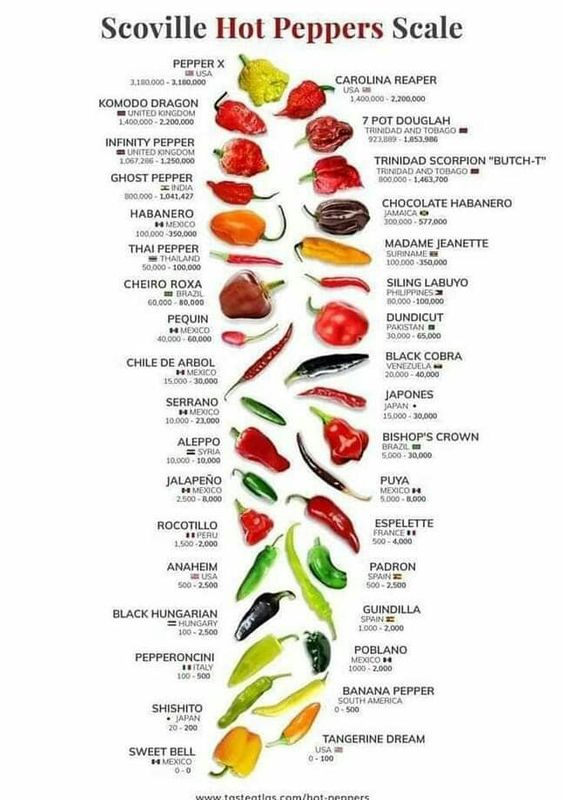
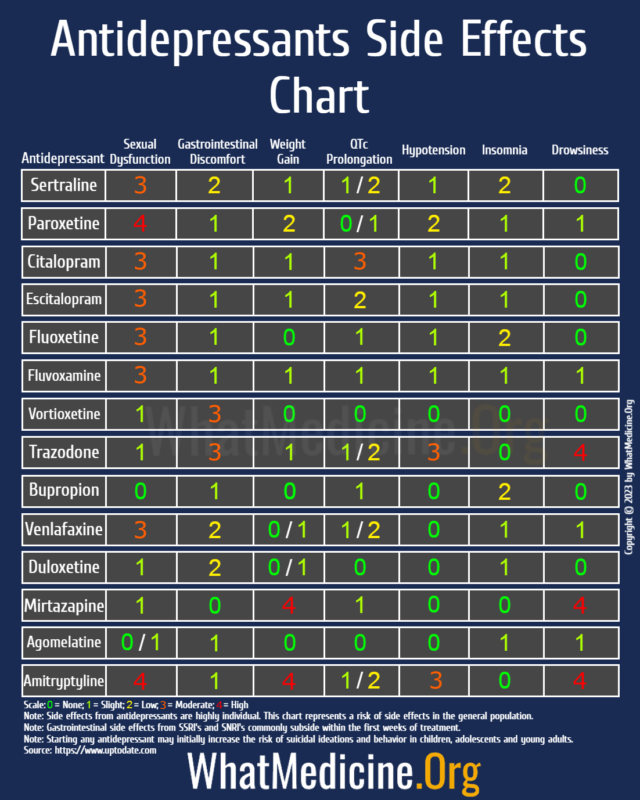
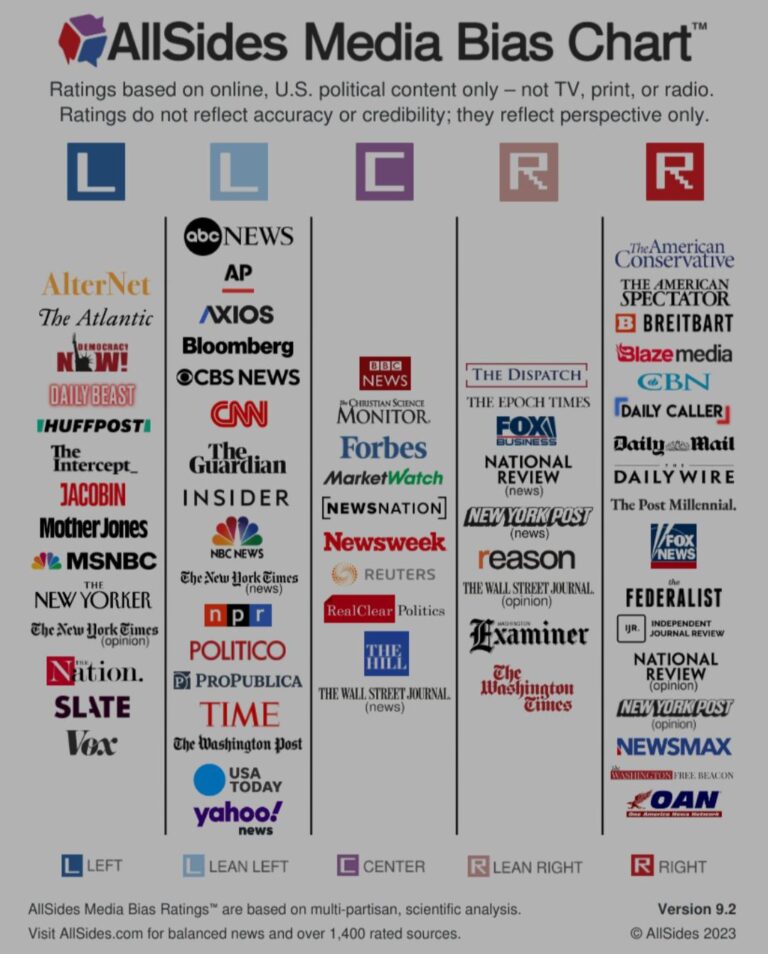
Two or more things side by side, so the differences and similarities stand out.
28 examples

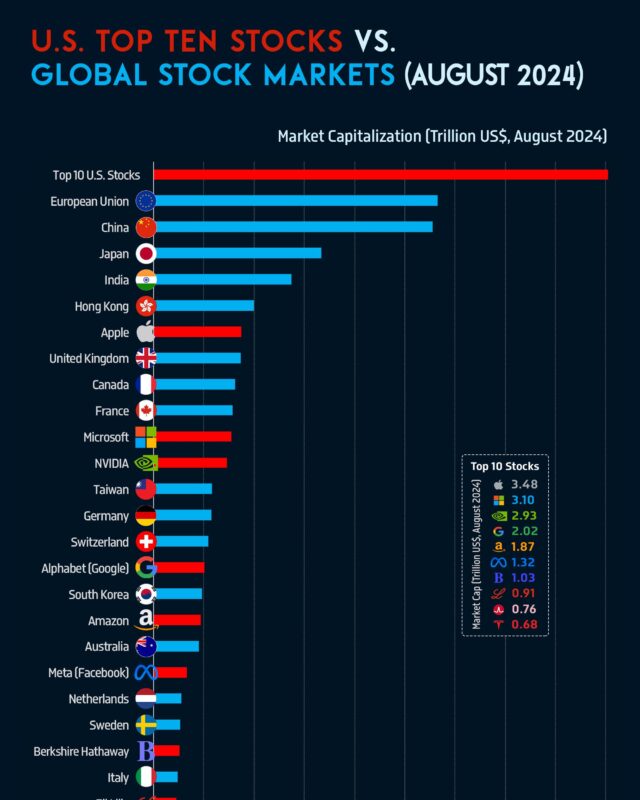




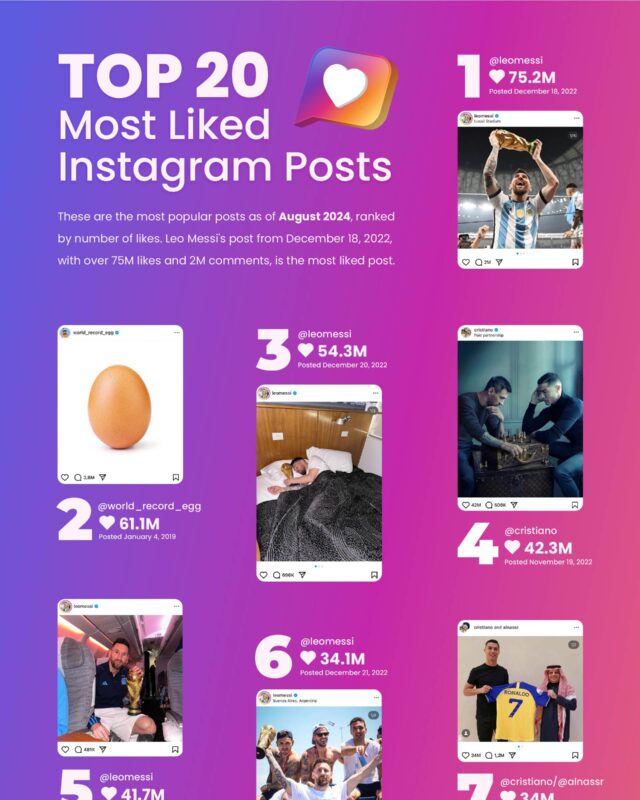
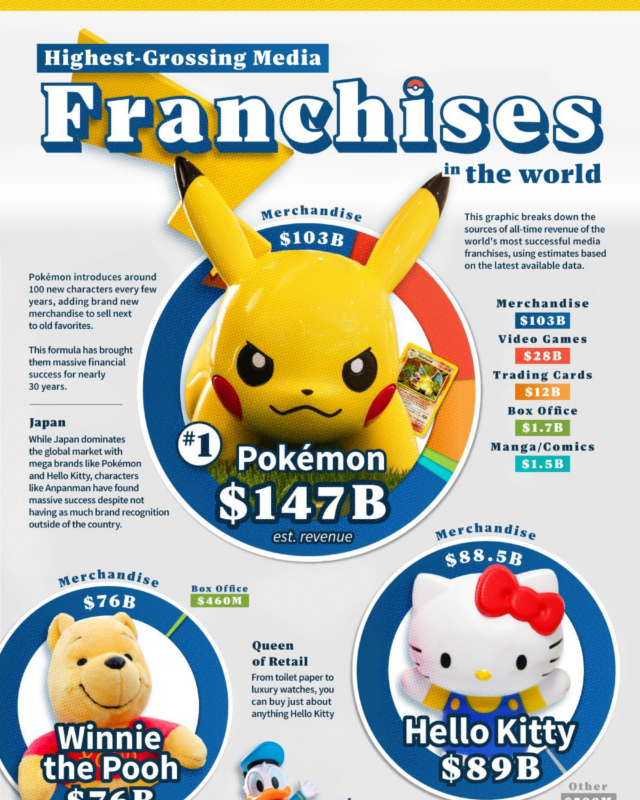
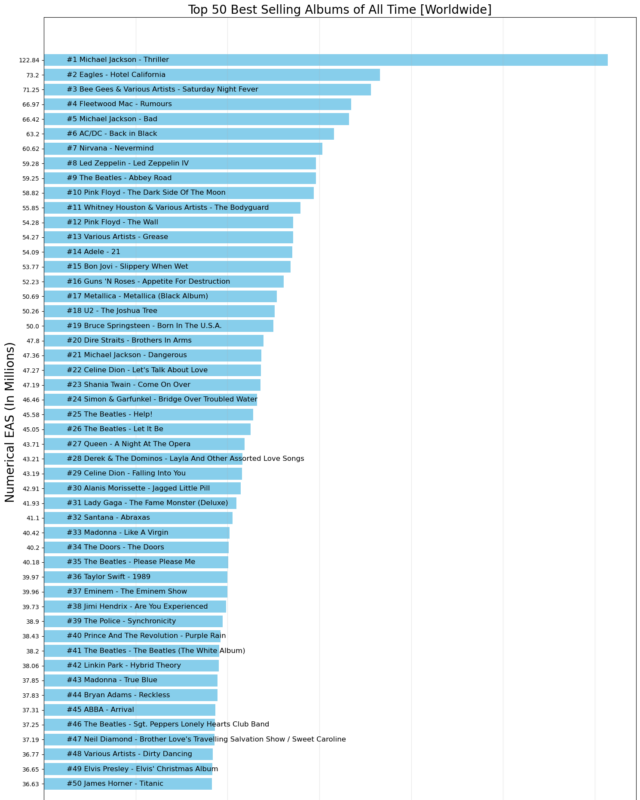
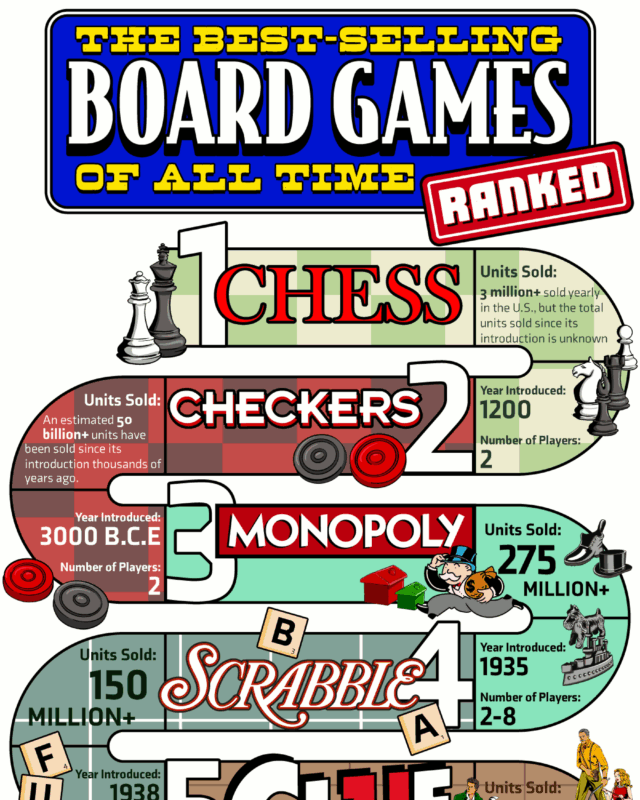
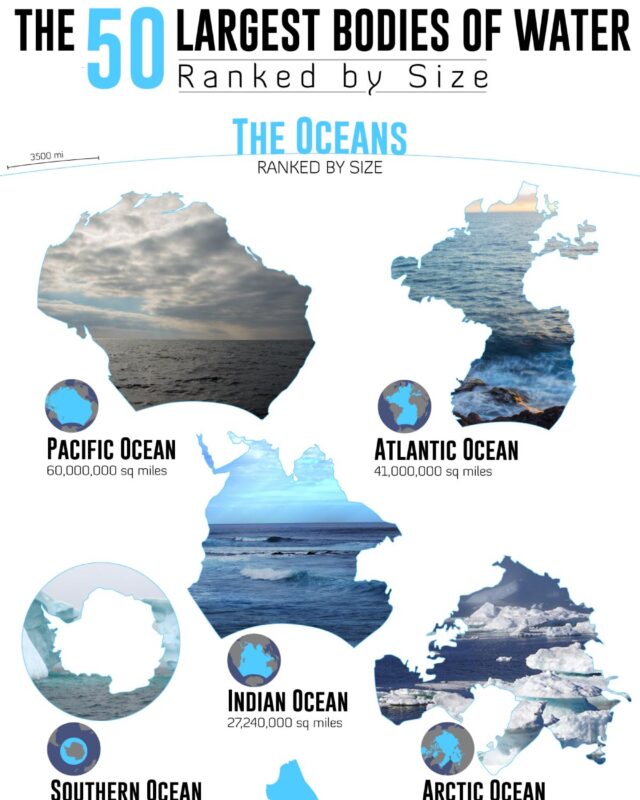
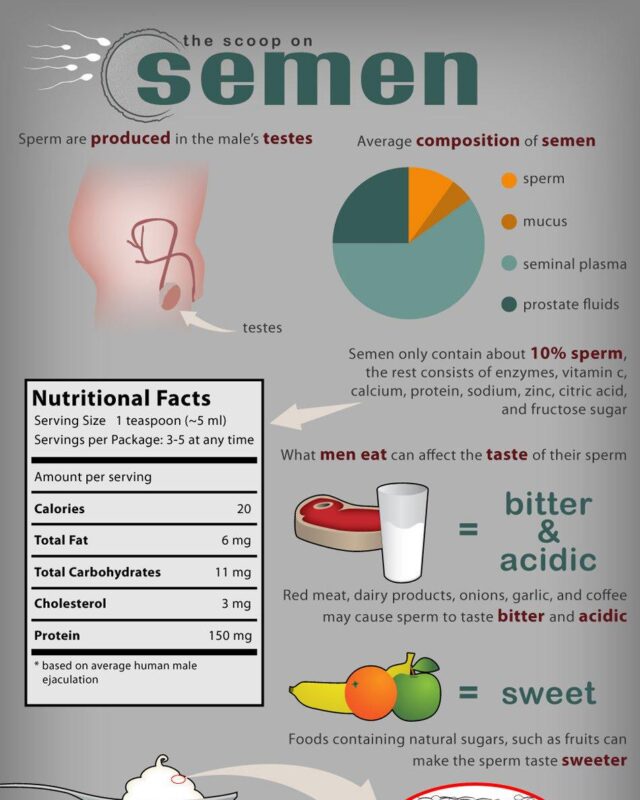
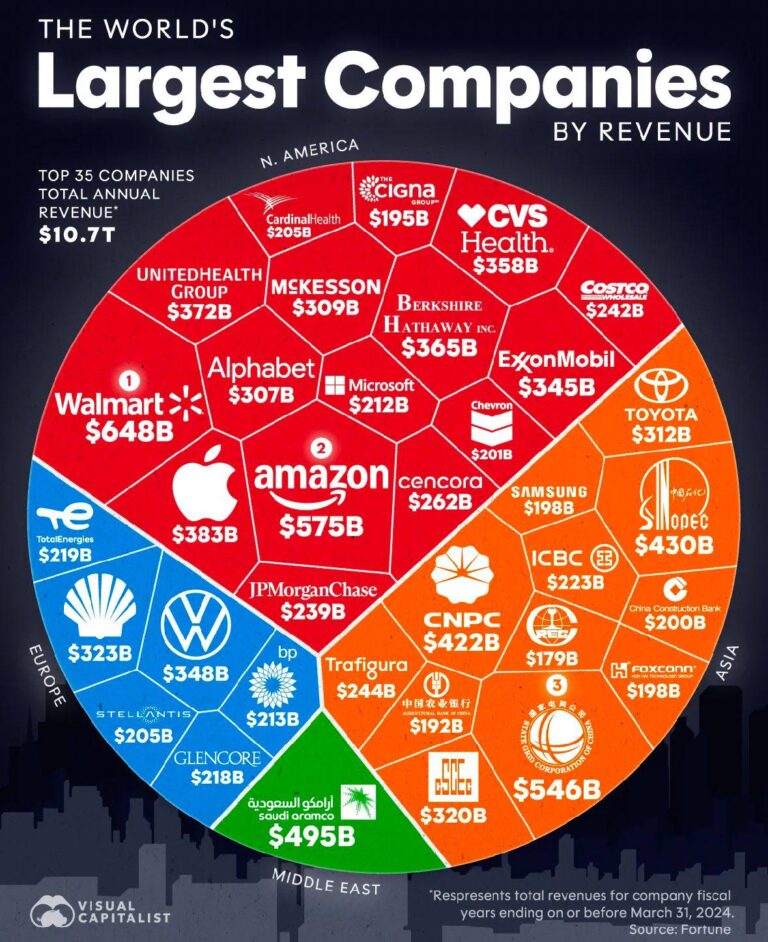
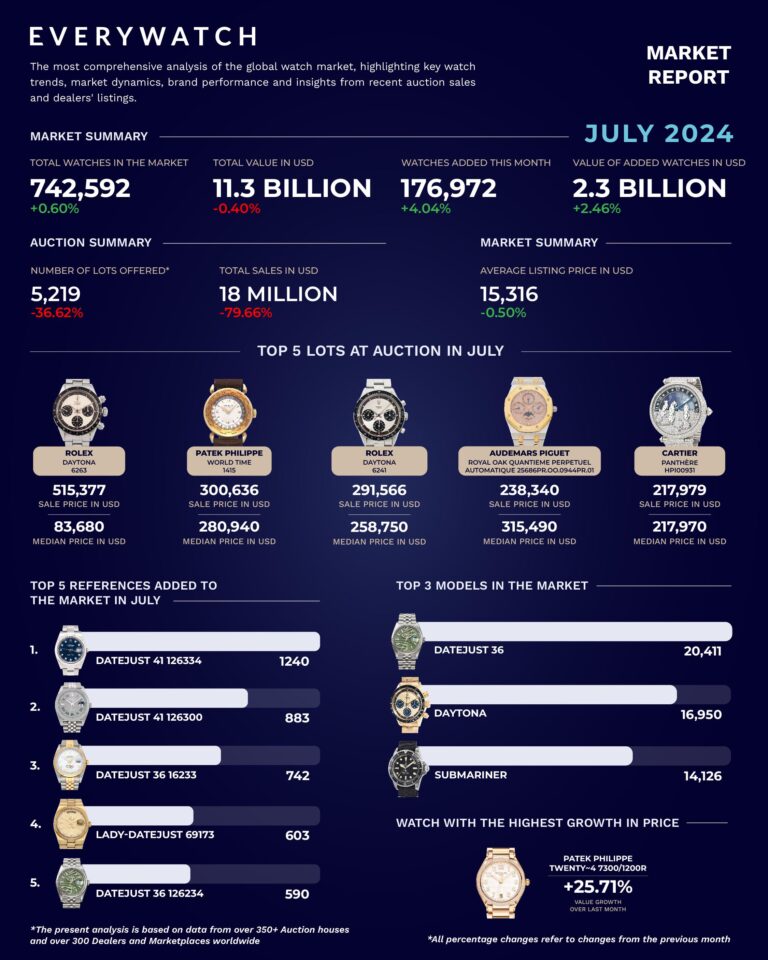
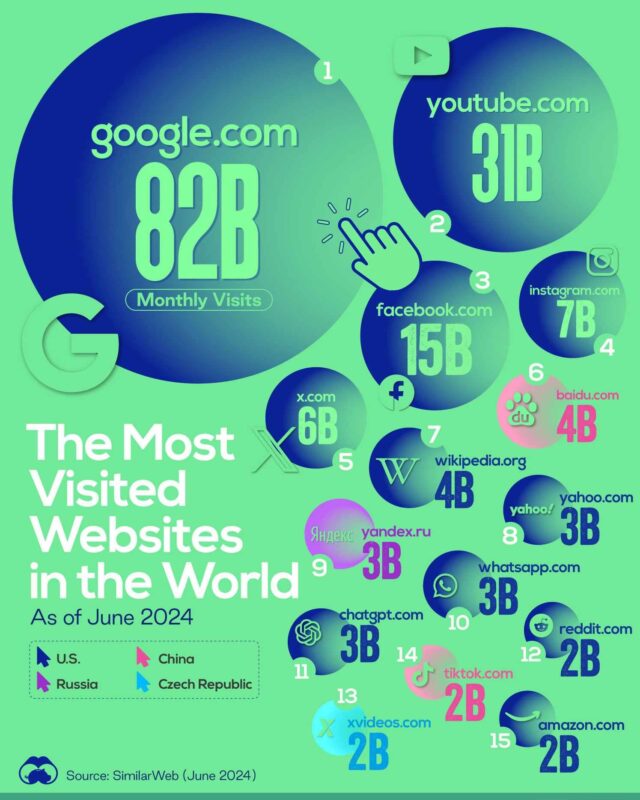
Rankings, shares and totals drawn as charts, so the biggest and smallest are easy to spot.
69 examples


Steps in order, with what to do at each one.
25 examples
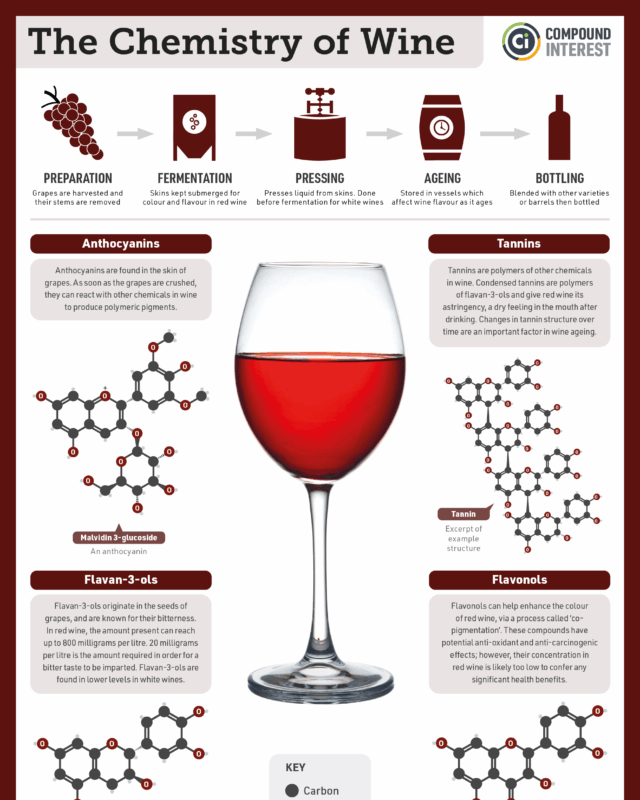
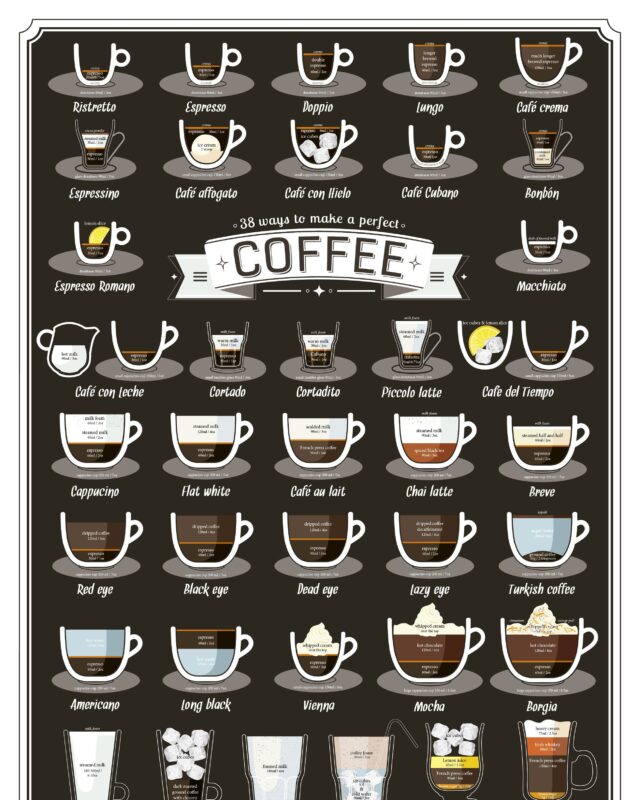


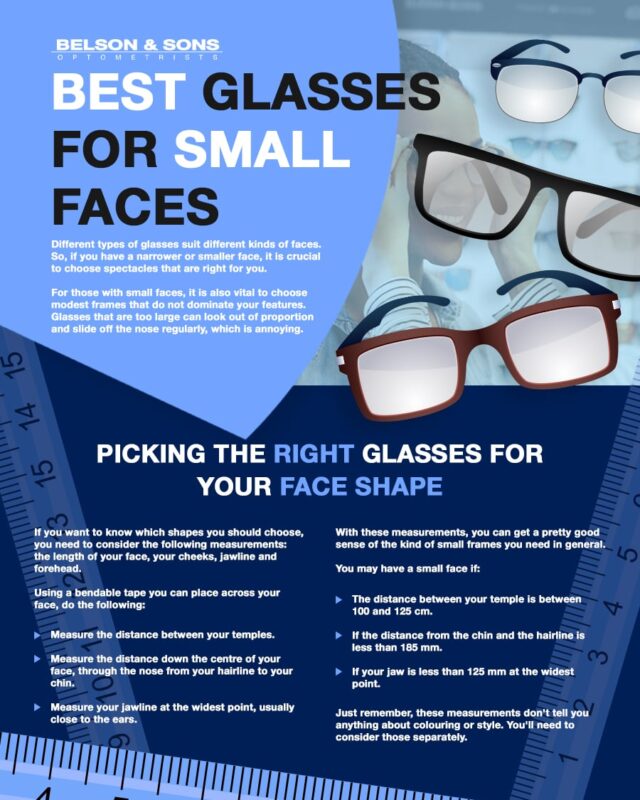
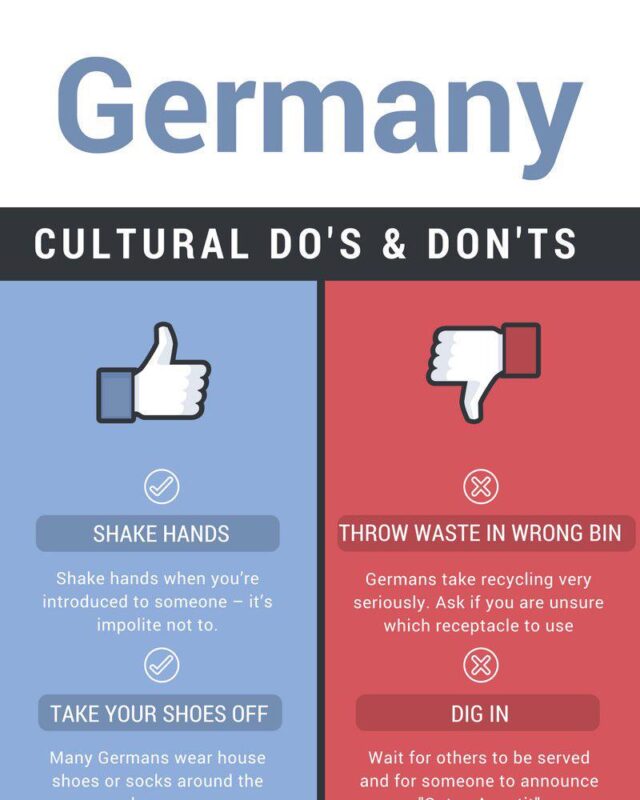
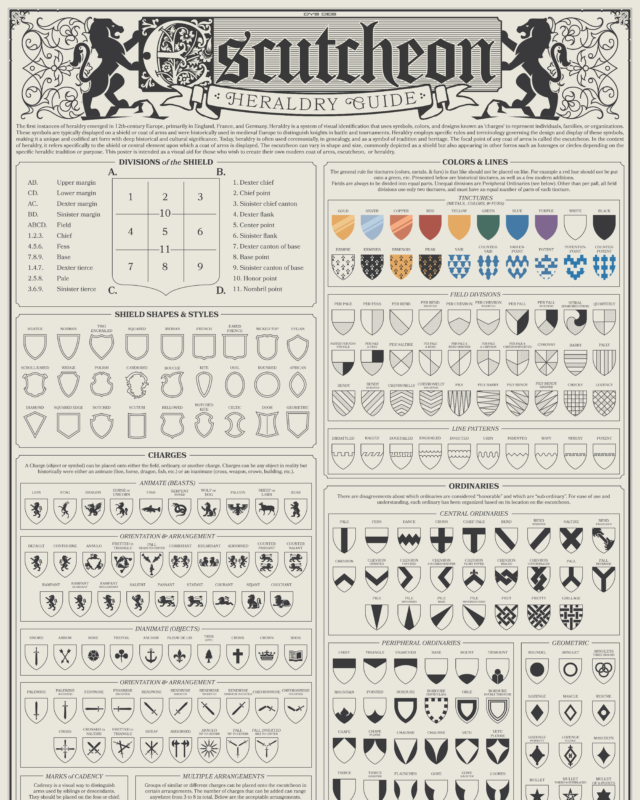

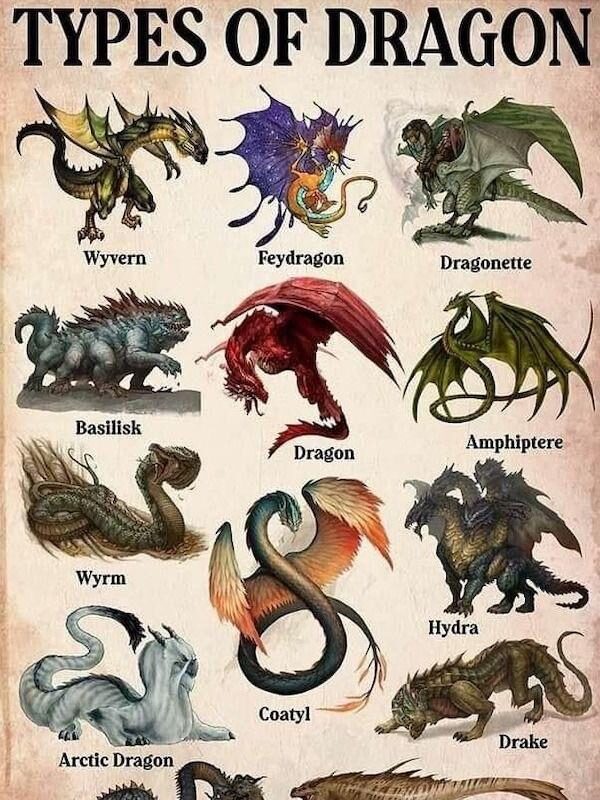
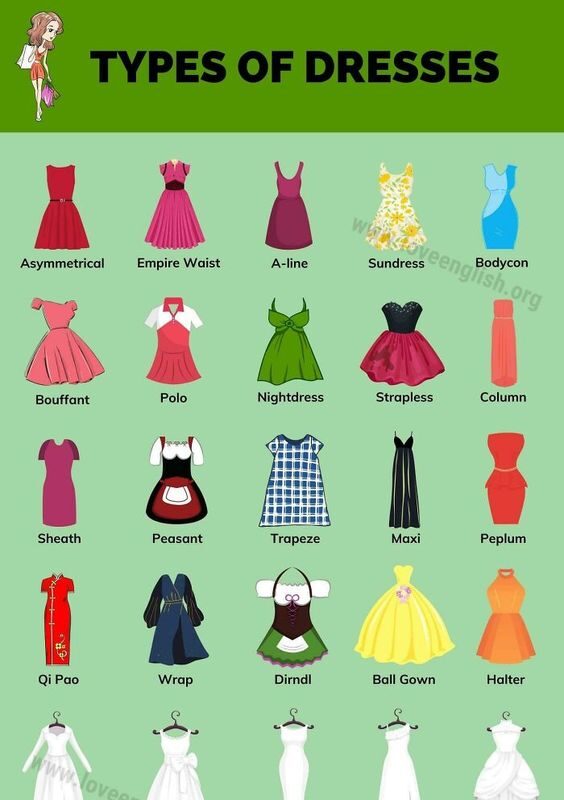
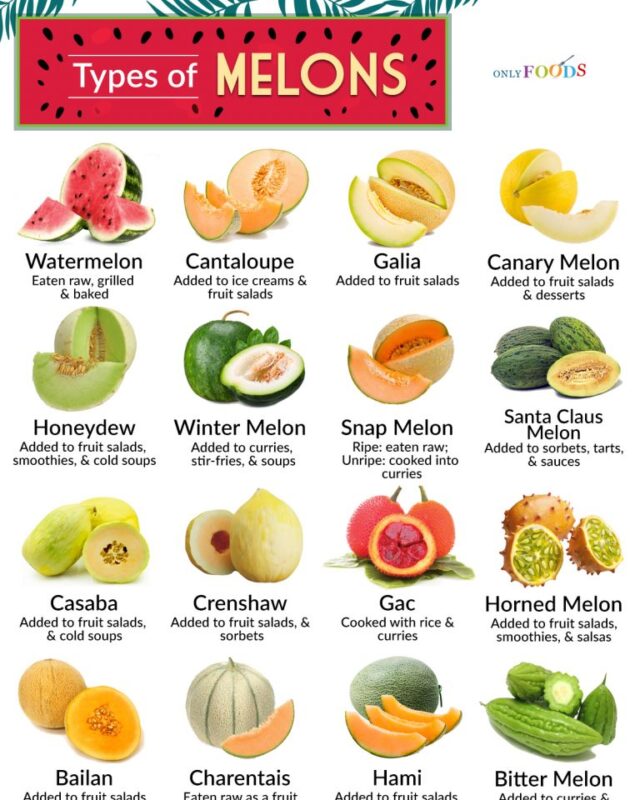
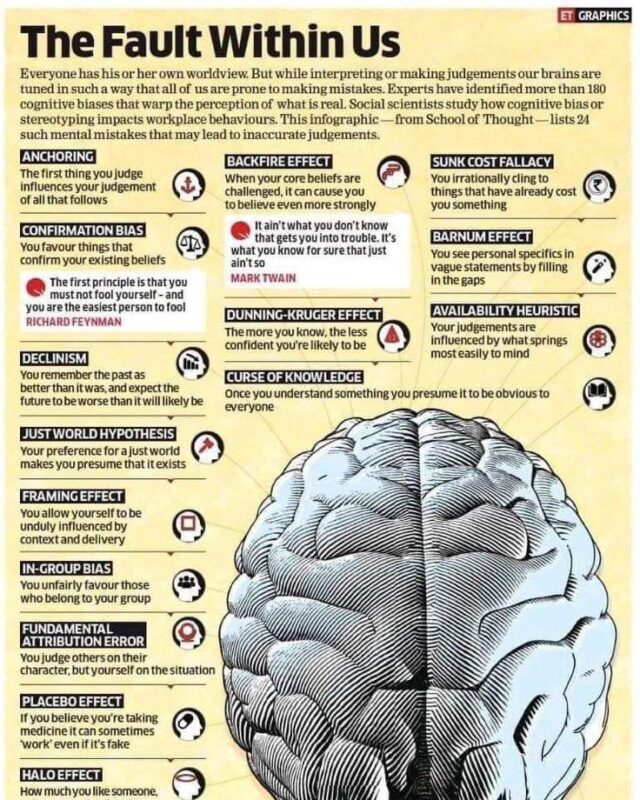
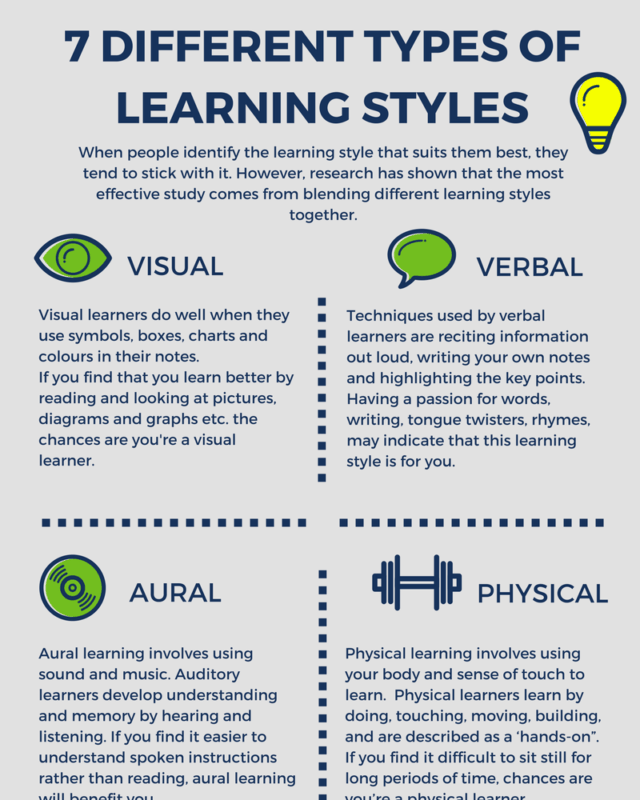
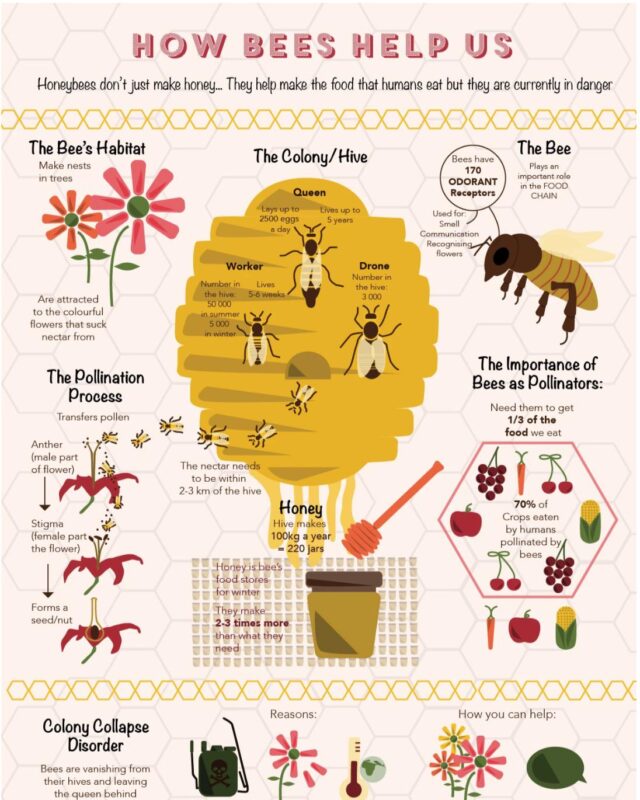
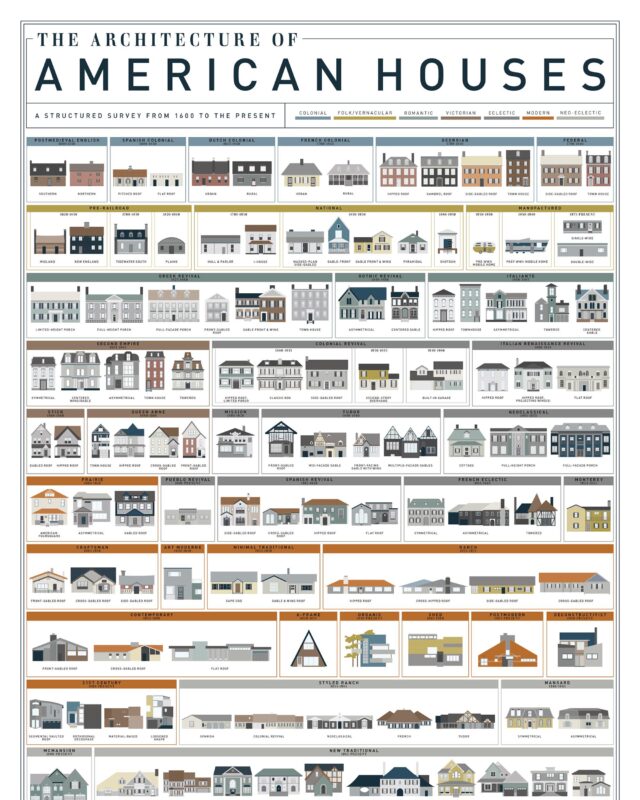
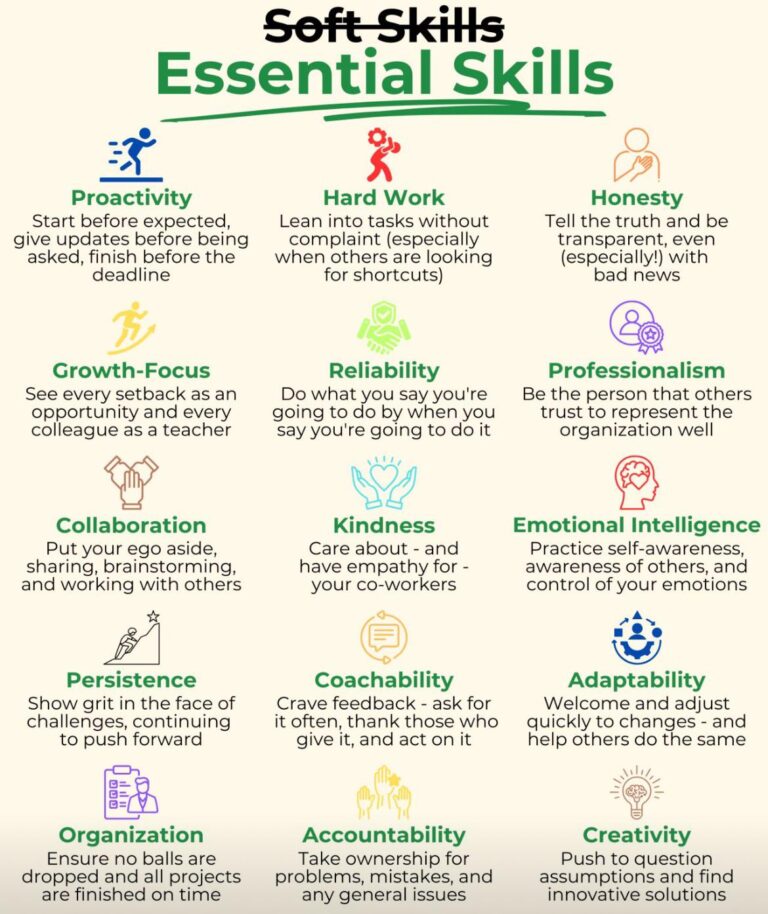
A set of facts, tips or examples on one subject, each with a short explanation.
30 examples









Give it a permanent page where people looking for your subject find it, with your name and a link to your site. Content marketers, agencies, designers and researchers all list here.