Education and Learning
Most infographics fall into a handful of types. Knowing which one fits your data makes the design easier to plan and easier to read. Here are the six you will see most often, each with real examples from our site.
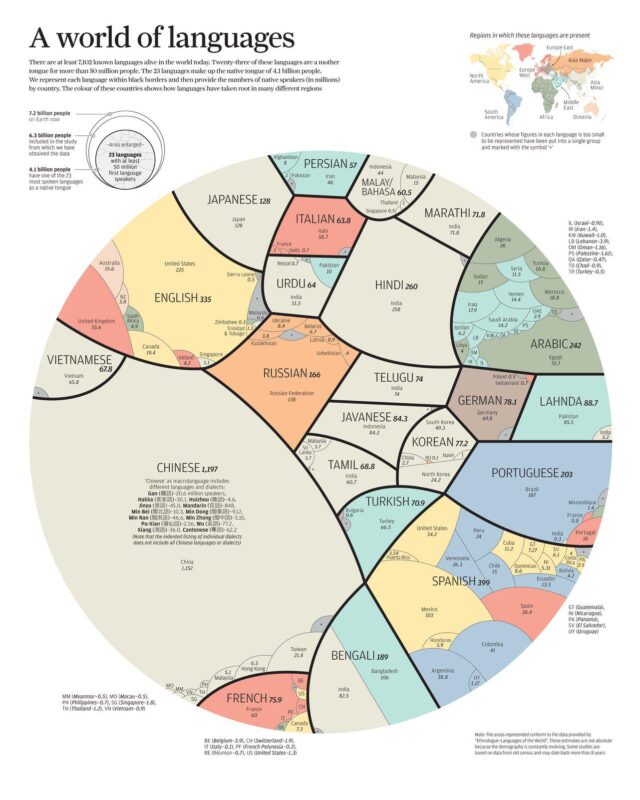
Data laid over a map, so you can compare places at a glance: countries, states, cities or routes.
Use a map when the place is the point of the story, for example how prices, laws, habits or languages change from one country to the next.


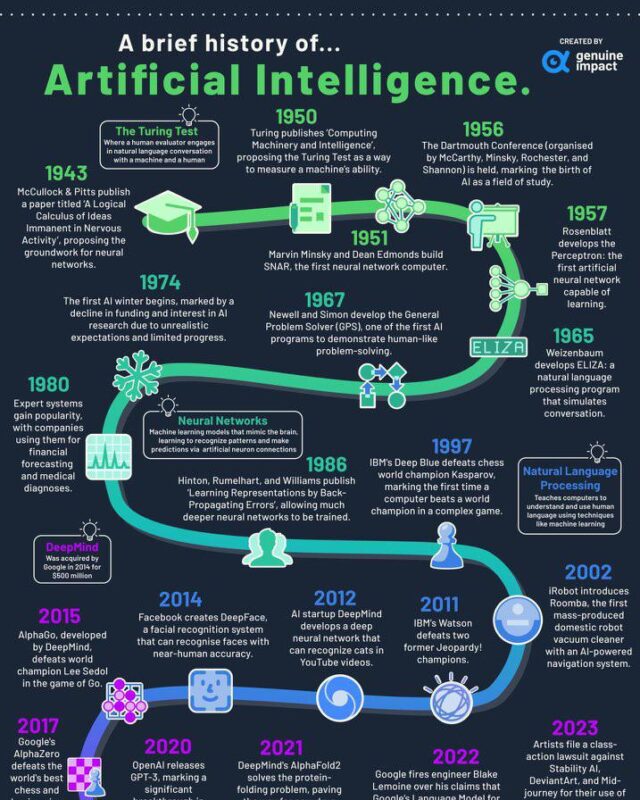
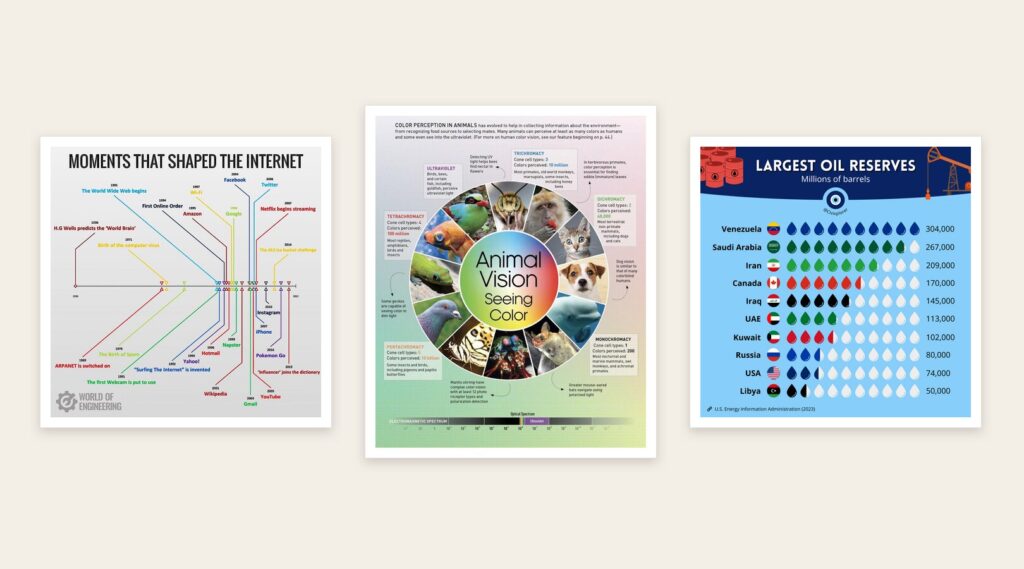
Events or changes set out in date order, so you can see how something developed over years or centuries.
Use a timeline when the order of events matters: the history of a product, a sport, a city or an idea.
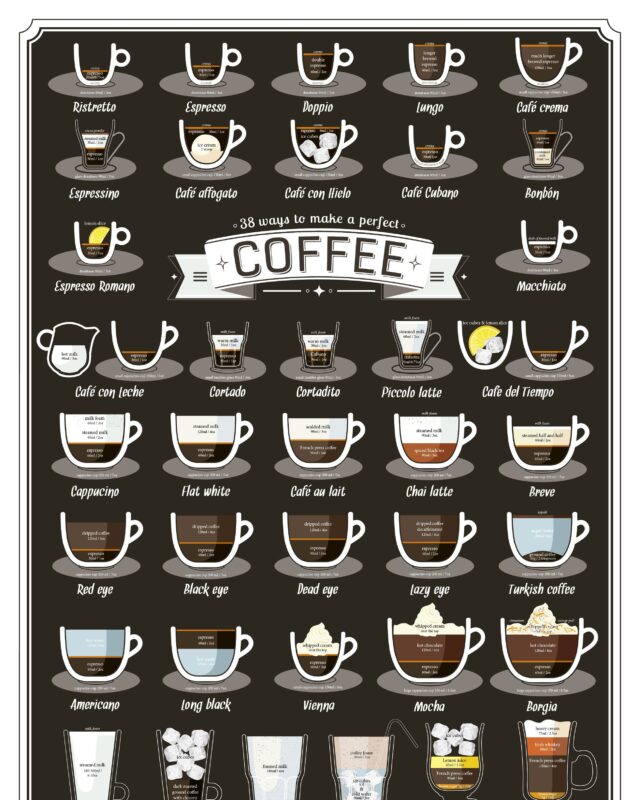
Two or more things side by side, so the differences and similarities stand out.
Use a comparison when your reader is choosing between options or wants to know how two things differ.

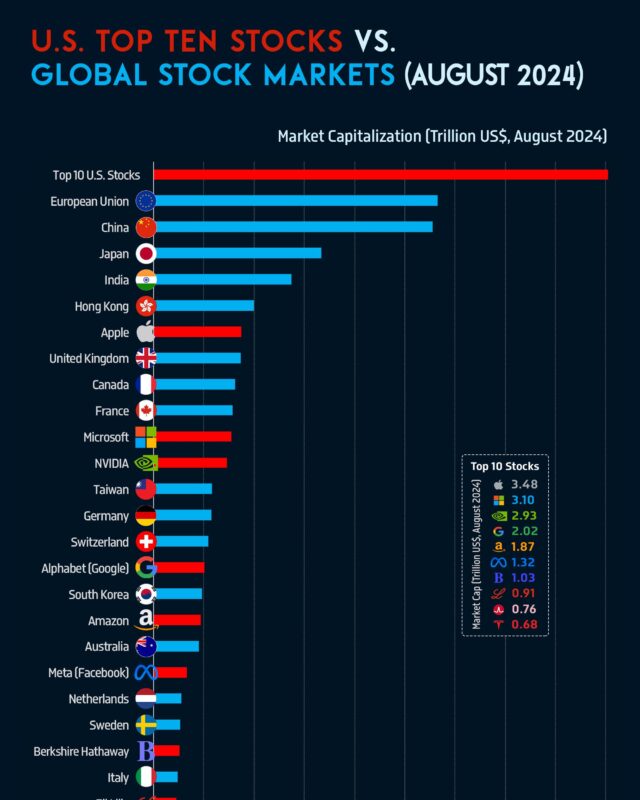


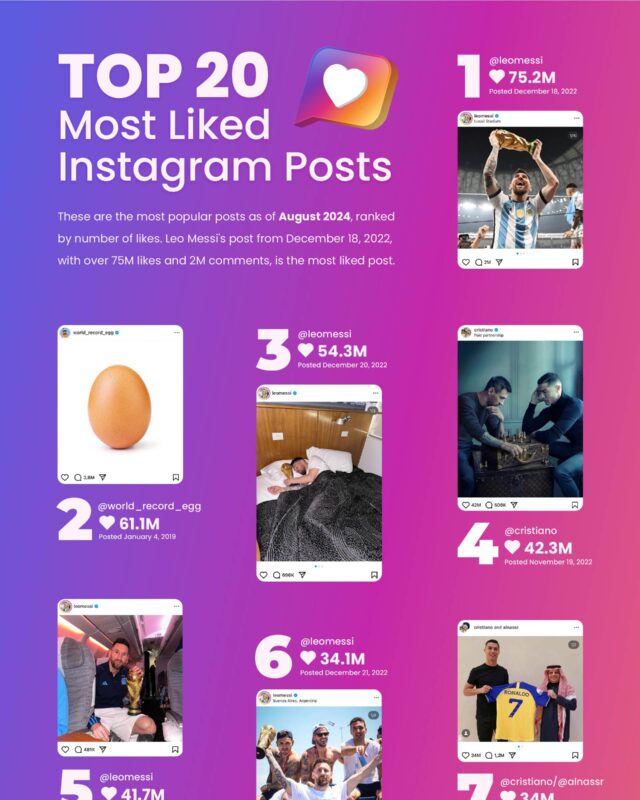
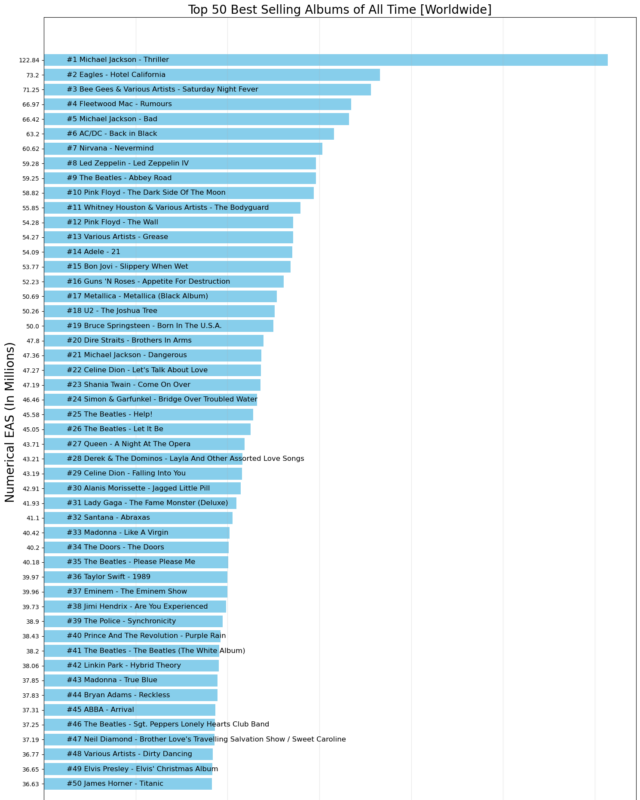
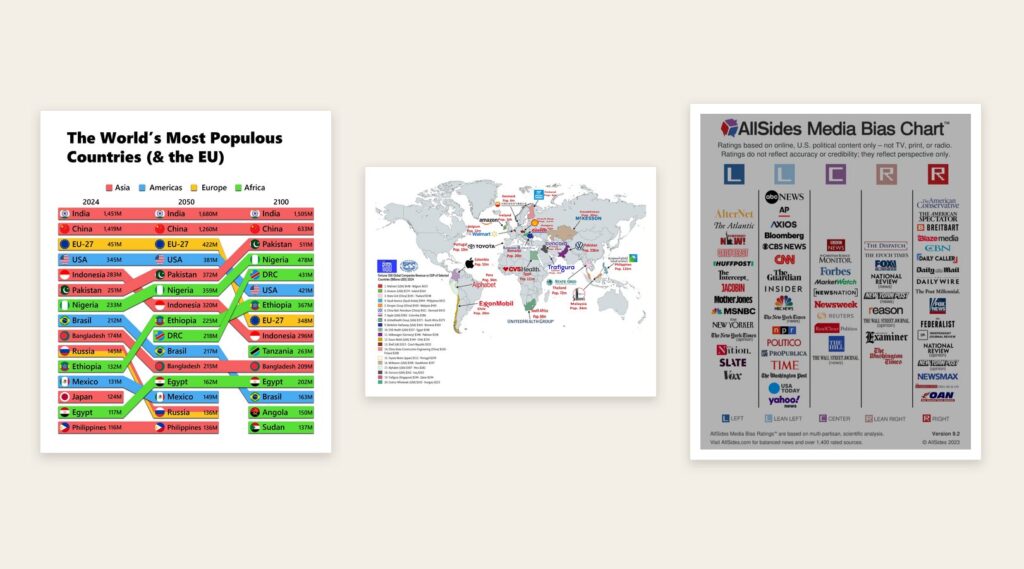
Rankings, shares and totals drawn as charts, so the biggest and smallest are easy to spot.
Use a statistical layout when the numbers are the story and your reader needs to see their size at a glance.

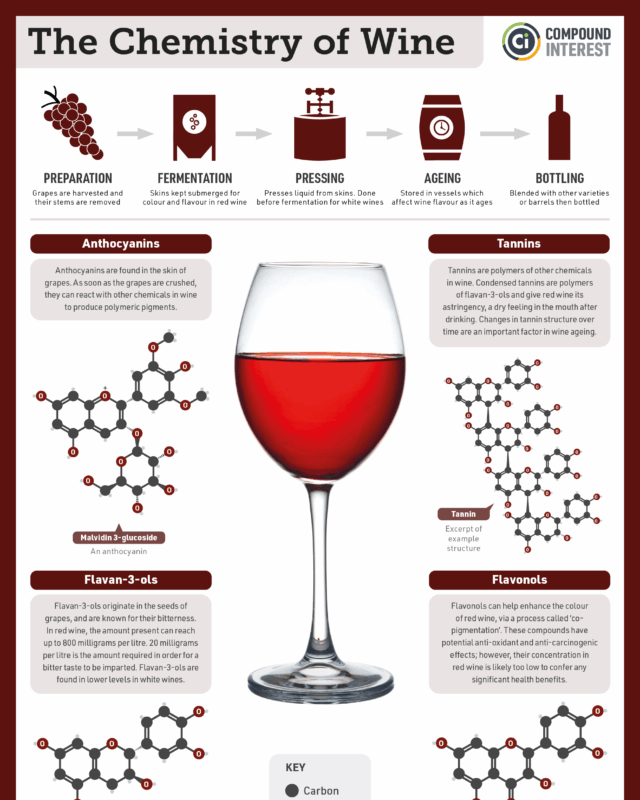
Steps in order, with what to do at each one.
Use a process layout when you are explaining how to do something or how something works.
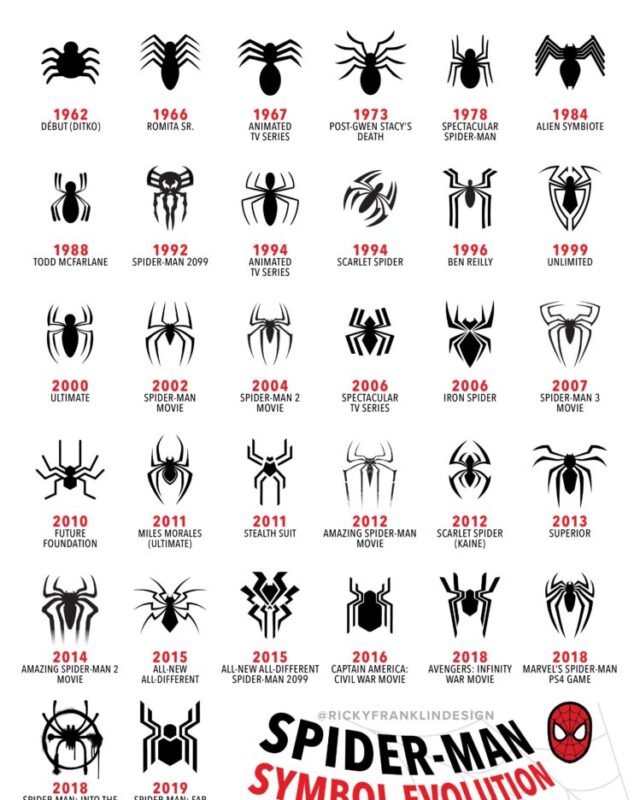
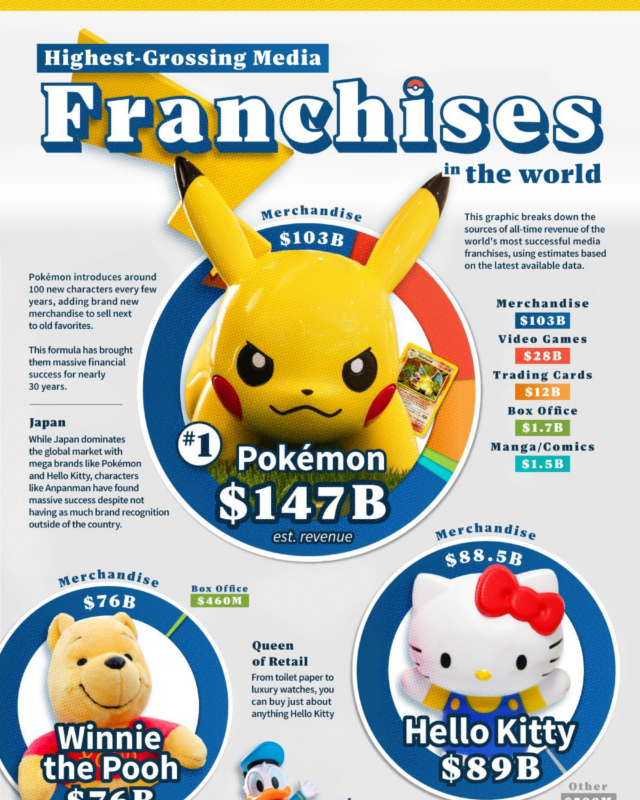
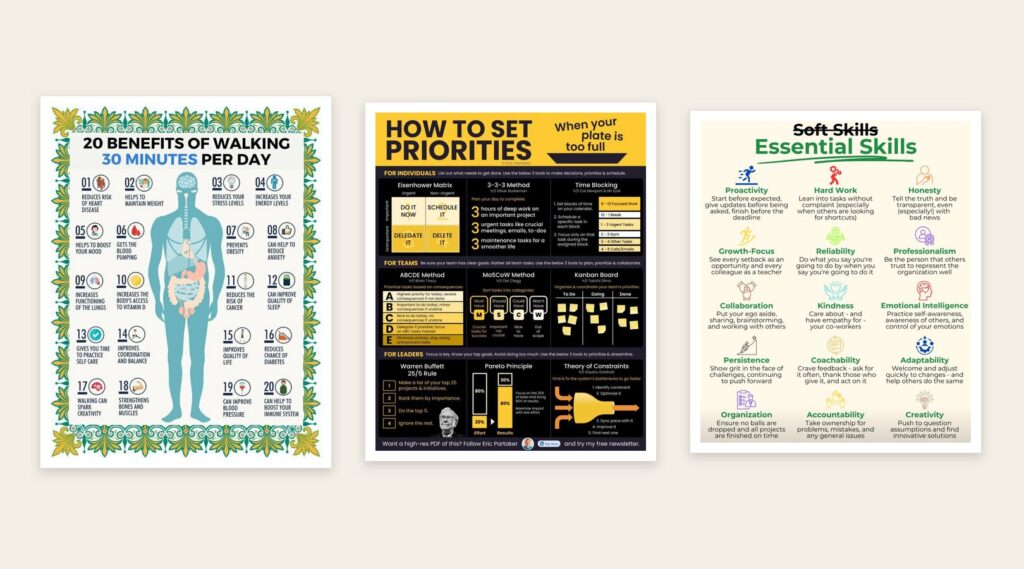
A set of facts, tips or examples on one subject, each with a short explanation.
Use a list when you have several separate points that do not need a chart, such as facts, tips or inventions.
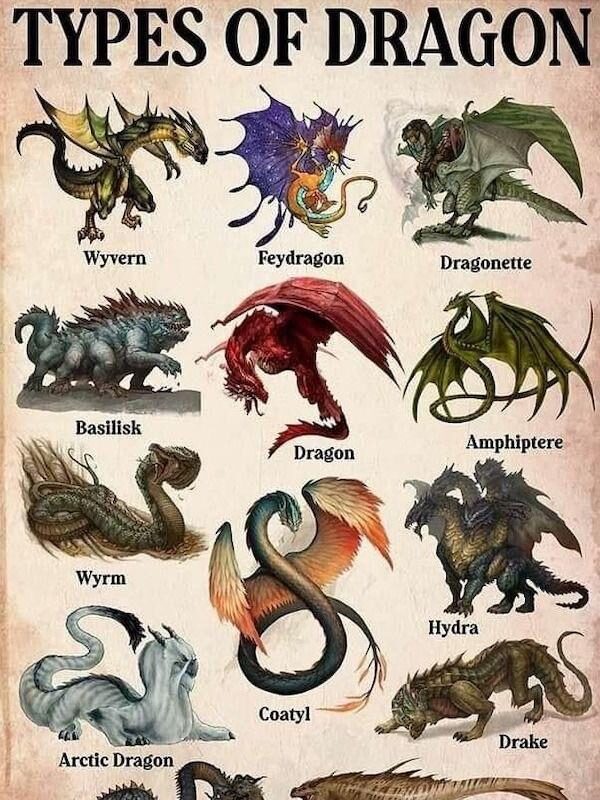
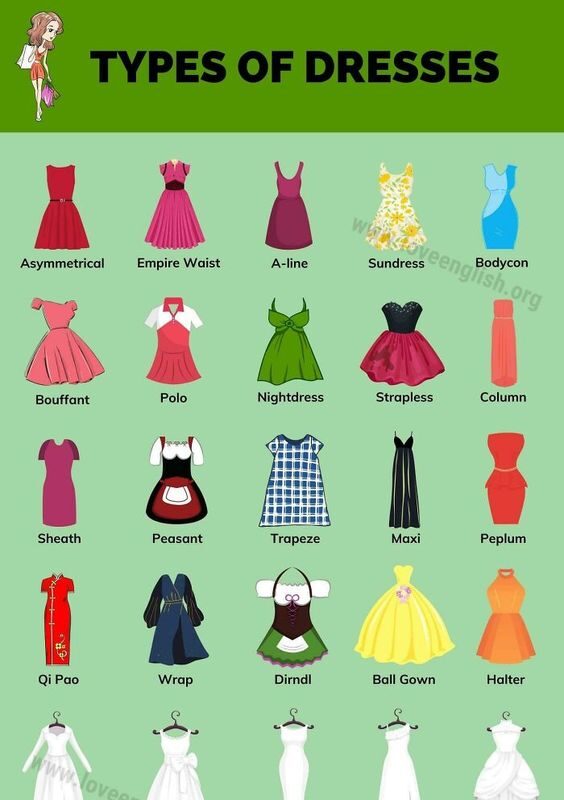

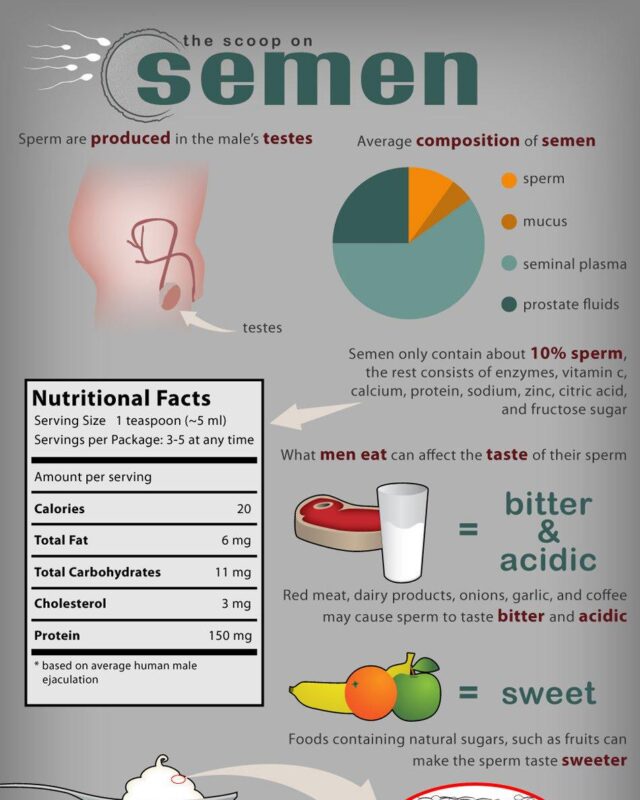
Start from your data. If it is about places, use a map. If it is about change over time, use a timeline. If it compares options, put them side by side. If the numbers are the story, chart them. If it explains how to do something, set out the steps. If it is a set of separate points, make a list.
What an infographic is, where the word comes from and what makes one work, with a short history of the format.
How to cite an infographic in your own work, and how to credit the sources behind an infographic you make.
A step-by-step guide to making an infographic in Microsoft Word when it is the only tool you have.
Give it a permanent page where people looking for your subject find it, with your name and a link to your site. Content marketers, agencies, designers and researchers all list here.