
Sports
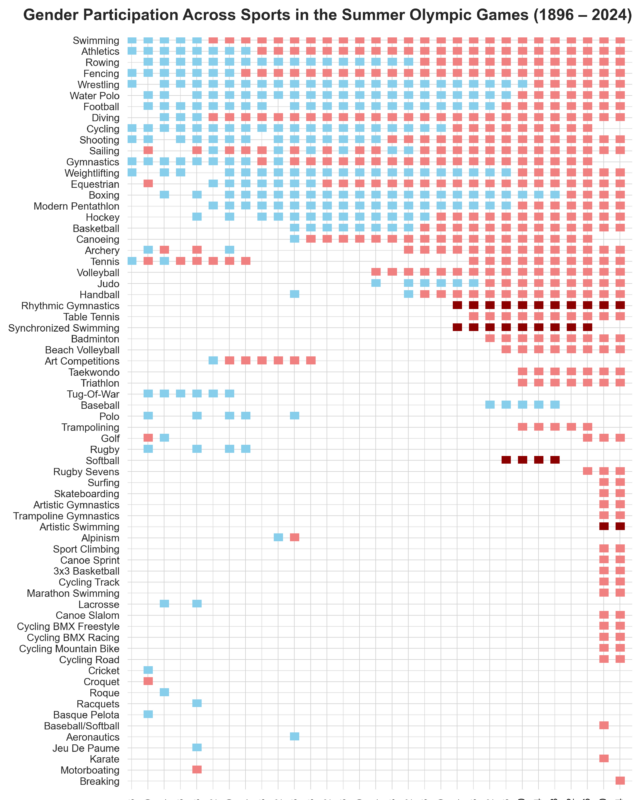
Gender Participation in Sports at the Summer Olympics
The first modern Olympics in 1896 had no women; Paris 2024 had 5,300 women among 10,813 athletes, and LA28 will be the first Games with more quota places…

Infographic publisher
Distribution of Things is a data blog run by Gaël and Natascha that explains social data through distributions, the histograms and density curves that show how often each value appears. They use open data from sources such as Kaggle and Google Dataset Search and build the charts in Python or R. Topics range from Olympic athletes and Nobel laureates to vaccines and wealth inequality. Here you will find their chart on women in Olympic sports.
The first modern Olympics in 1896 had no women; Paris 2024 had 5,300 women among 10,813 athletes, and LA28 will be the first Games with more quota places…
Is this your work? Tell us about a credit, a correction or a better description, and we will update this page.
Give it a permanent page where people looking for your subject find it, with your name and a link to your site. Content marketers, agencies, designers and researchers all list here.