

Education and Learning
Out-of-School Rates by Region and Elementary School Age Range
Sub-Saharan Africa is highest at every level, from 18.9% of primary-age children to 57.5% of upper secondary age, and has 97.4 million out of school.

Creator on Tableau Public
Dom Brady is a Tableau and Alteryx consultant at The Information Lab, based in London. He builds interactive data visualisations in Tableau as personal projects and for community challenges such as Makeover Monday. His work here covers the UK tax burden against other OECD countries, global gold demand using World Gold Council data, and out-of-school rates by region.
Based in United Kingdom (London)
Sub-Saharan Africa is highest at every level, from 18.9% of primary-age children to 57.5% of upper secondary age, and has 97.4 million out of school.
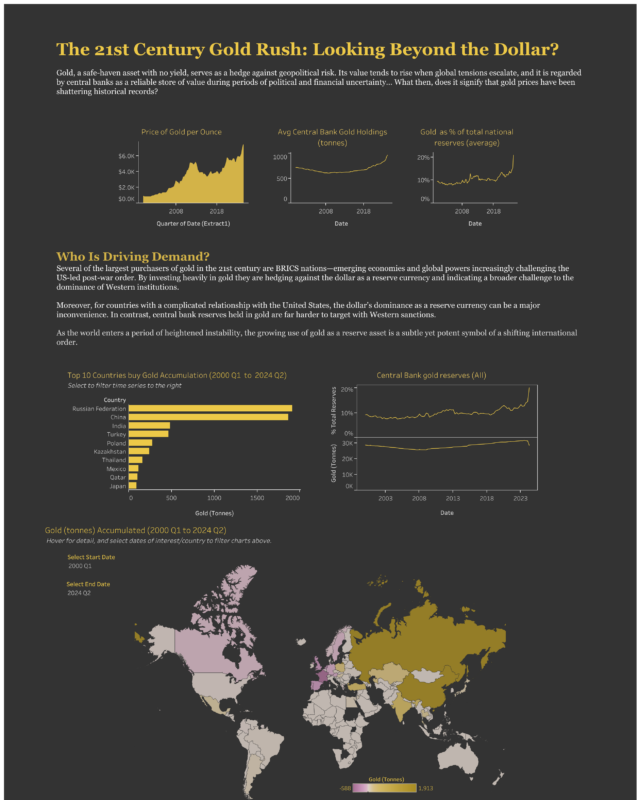
After selling gold in the 1990s, they have bought it every year since 2010 and more than 1,000 tonnes a year from 2022 to 2024, led over the period by…
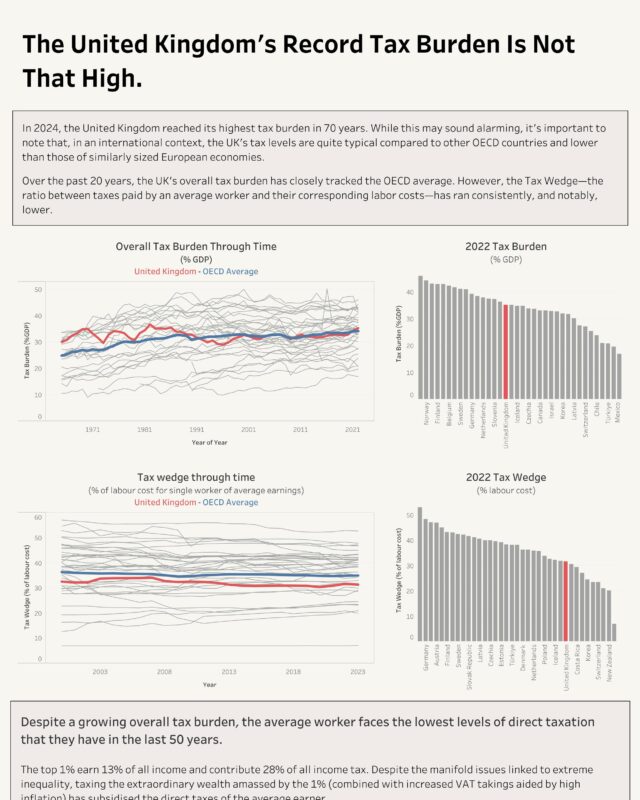
By the UK's own history it is high and rising: the OBR puts the tax take at 36.0% of GDP in 2025-26 and expects it to pass its historical high of 37.2% in…
Is this your work? Tell us about a credit, a correction or a better description, and we will update this page.
Give it a permanent page where people looking for your subject find it, with your name and a link to your site. Content marketers, agencies, designers and researchers all list here.