
Finance and Economy
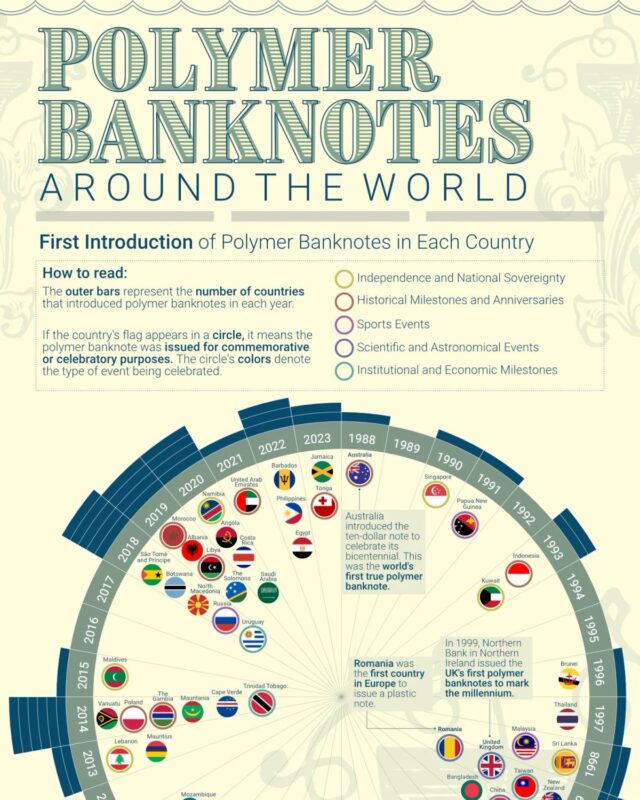
Polymer Banknotes Around the World and When Each Country Switched
Australia issued the first in 1988, and by 2023 about 58 countries had introduced at least one.

Infographic creator
Edit Gyenge creates charts and maps for Visual Capitalist, the publisher of data graphics on markets and the economy. Her work ranks and maps topics such as the world's largest banks, company profit margins, household debt across US states, the countries building AI models and when each country introduced polymer banknotes. You will find her full set of graphics on her Visual Capitalist creator page.
Australia issued the first in 1988, and by 2023 about 58 countries had introduced at least one.
Is this your work? Tell us about a credit, a correction or a better description, and we will update this page.
Give it a permanent page where people looking for your subject find it, with your name and a link to your site. Content marketers, agencies, designers and researchers all list here.