
Food and Drink
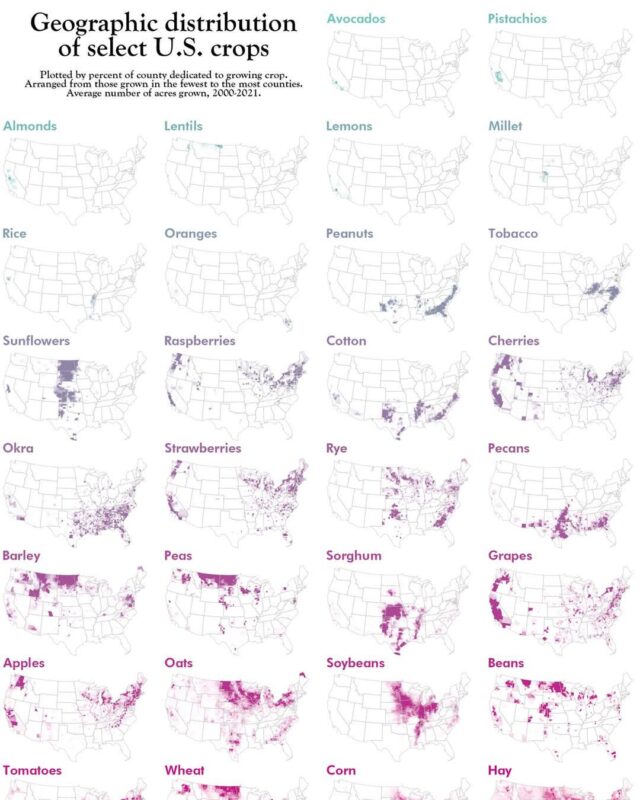
Geographic Distribution of Select US Crops in 30 Maps
These maps by Erin Davis show the geographic distribution of select US crops, shading every county by the share of its land used for each of 30 crops,…

Infographic creator
Erin Davis is a data visualisation journalist at Axios who lives in Portland, Oregon. On her blog Data Stuff she publishes data stories, maps and charts on everyday questions, such as which crop is grown most across the United States. She does almost all of her work in R, from collecting and analysing the data to drawing the final charts.
These maps by Erin Davis show the geographic distribution of select US crops, shading every county by the share of its land used for each of 30 crops,…
Is this your work? Tell us about a credit, a correction or a better description, and we will update this page.
Give it a permanent page where people looking for your subject find it, with your name and a link to your site. Content marketers, agencies, designers and researchers all list here.