
Technology
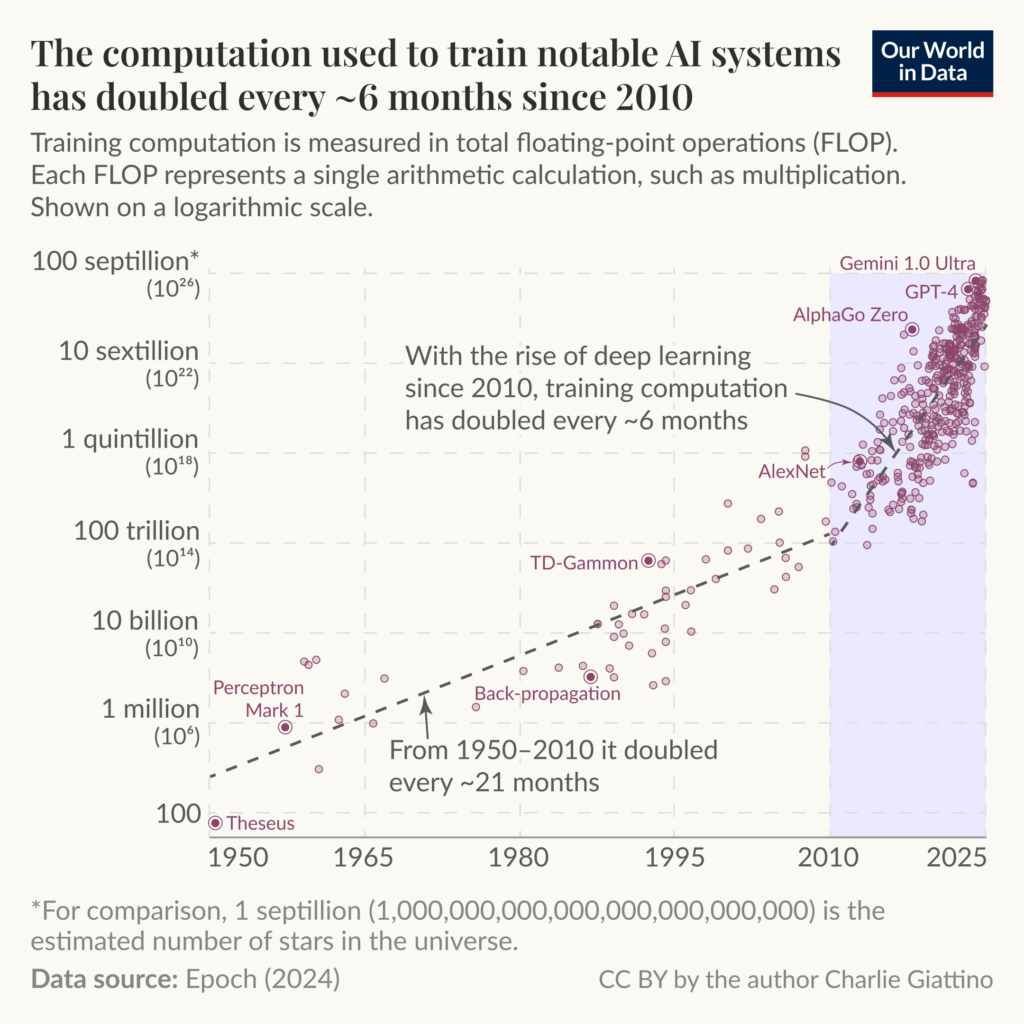
AI Training Compute Growth Chart, 1950 to 2025
Training compute doubled about every 21 months until 2010 and about every 6 months since, rising from Theseus in 1950 to GPT-4 and Gemini 1.0 Ultra in 2023.

Infographic publisher
Our World in Data is a free, non-profit website that publishes research and data on the world's largest problems. It is produced by researchers at the University of Oxford and the non-profit Global Change Data Lab. You will find articles, short data explainers and over 14,000 interactive charts on more than 120 topics, from poverty and global health to climate change, conflict and artificial intelligence.
Based in United Kingdom, Oxford
Training compute doubled about every 21 months until 2010 and about every 6 months since, rising from Theseus in 1950 to GPT-4 and Gemini 1.0 Ultra in 2023.
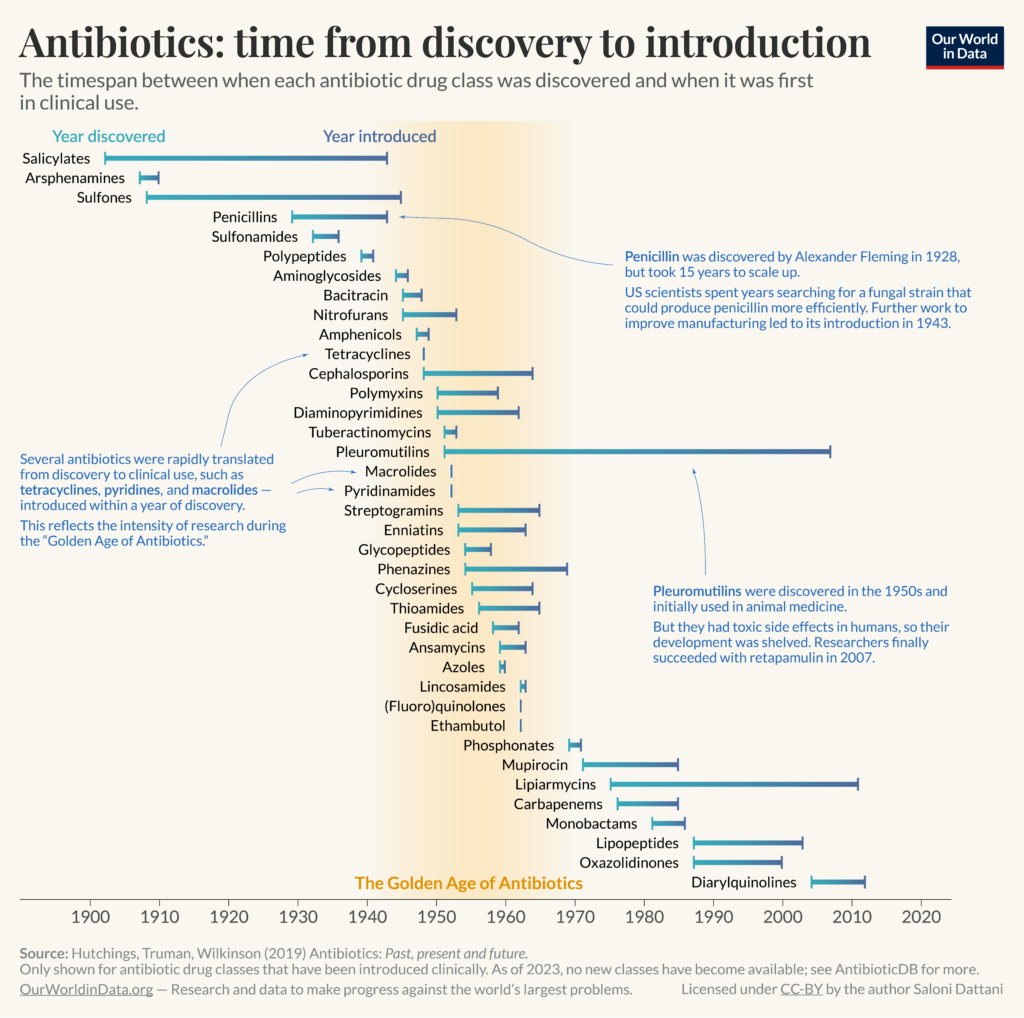
Penicillin, found in 1928, took 15 years to reach patients, while several classes from the 1950s were in use within a year.
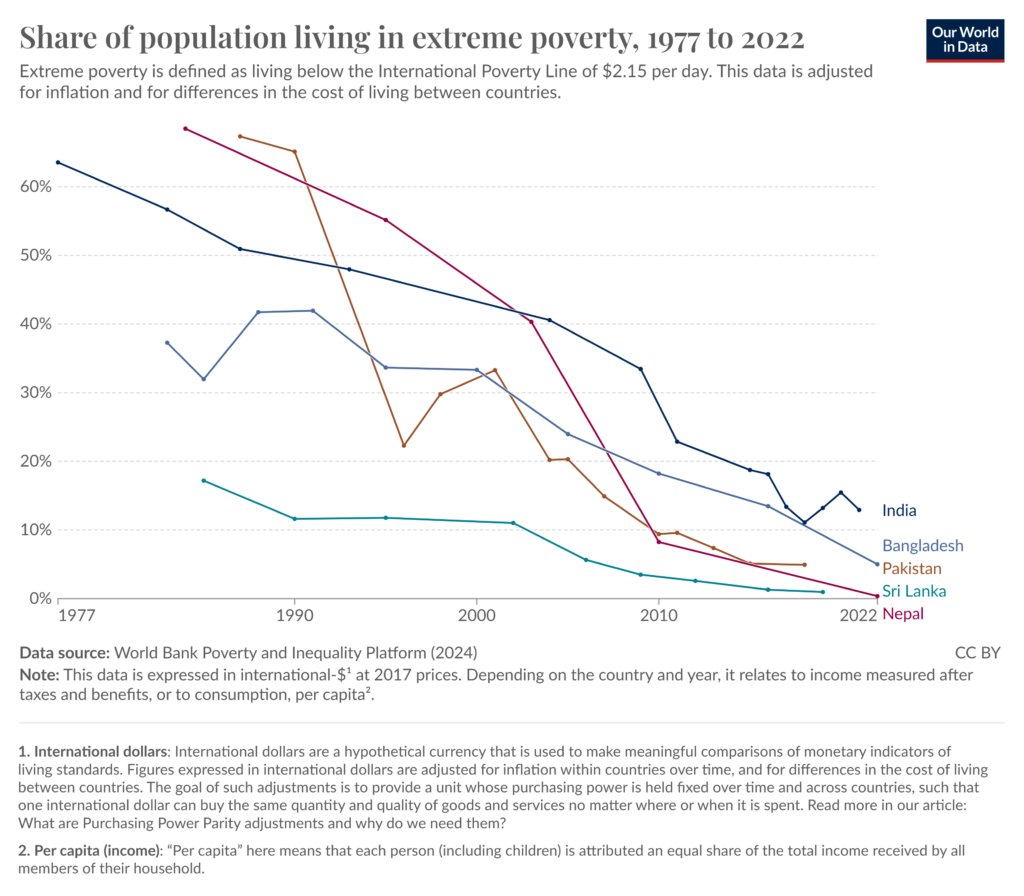
Nepal drops from above 60% to close to zero, while India ends highest of the five at roughly 13%.
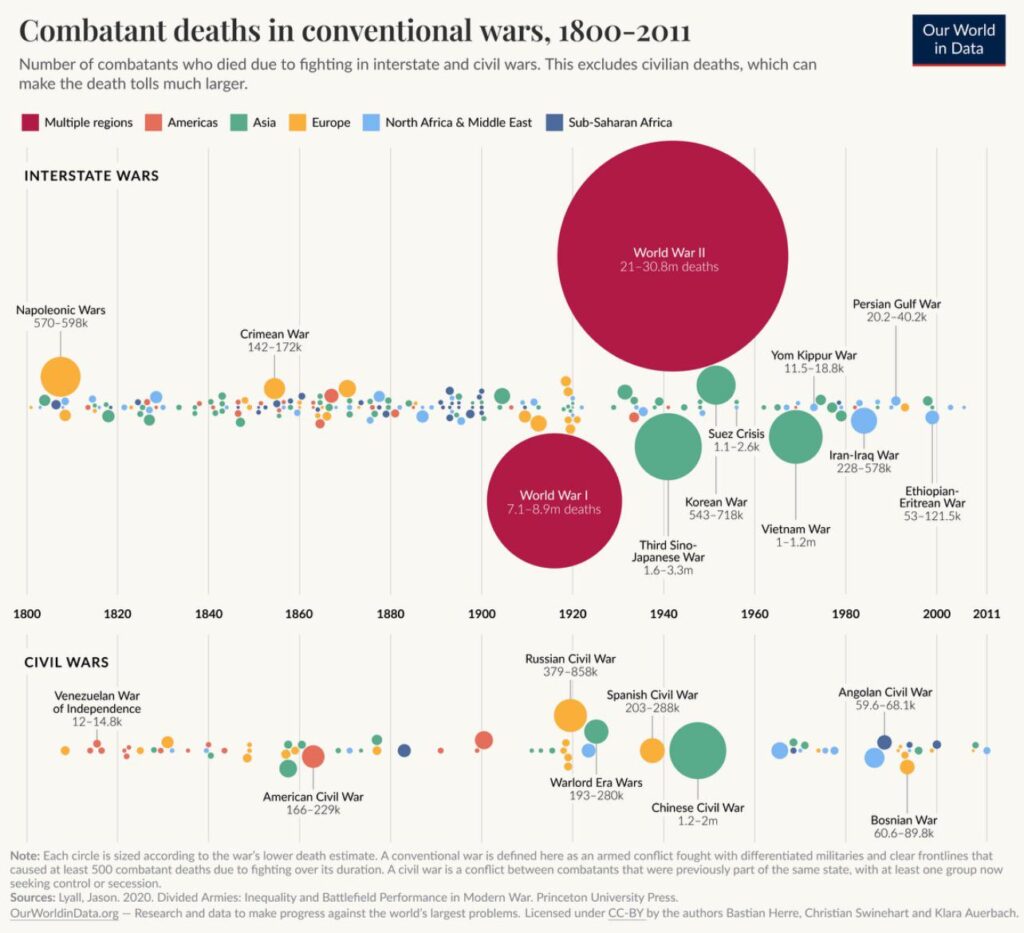
The ten deadliest wars account for 90% of the total, while most conventional wars killed a few thousand soldiers.
Is this your work? Tell us about a credit, a correction or a better description, and we will update this page.
Give it a permanent page where people looking for your subject find it, with your name and a link to your site. Content marketers, agencies, designers and researchers all list here.