
Politics
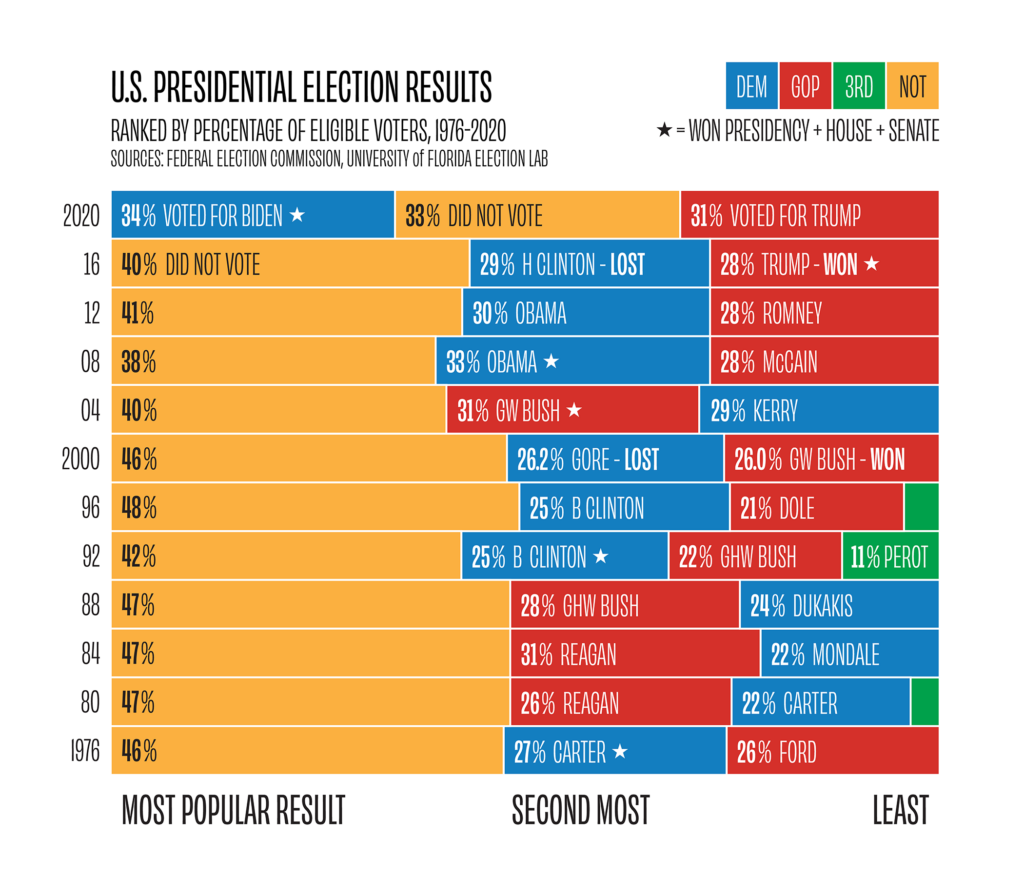
Presidential Election Results 1976 to 2020 Including Non-Voters
Not voting was the most common result in 11 of the 12 elections, peaking at 48% in 1996.

Creator on Reddit
ptrdo is the online handle of Peter Sylwester, who posts original data visualisations on Reddit and writes on Medium, with the Bluesky tagline Visualizing for goodness sake. His charts here focus on US presidential elections, including results from 1976 to 2020 drawn with non-voters counted and the winning margins of every election from 1924 to 2024.
Not voting was the most common result in 11 of the 12 elections, peaking at 48% in 1996.
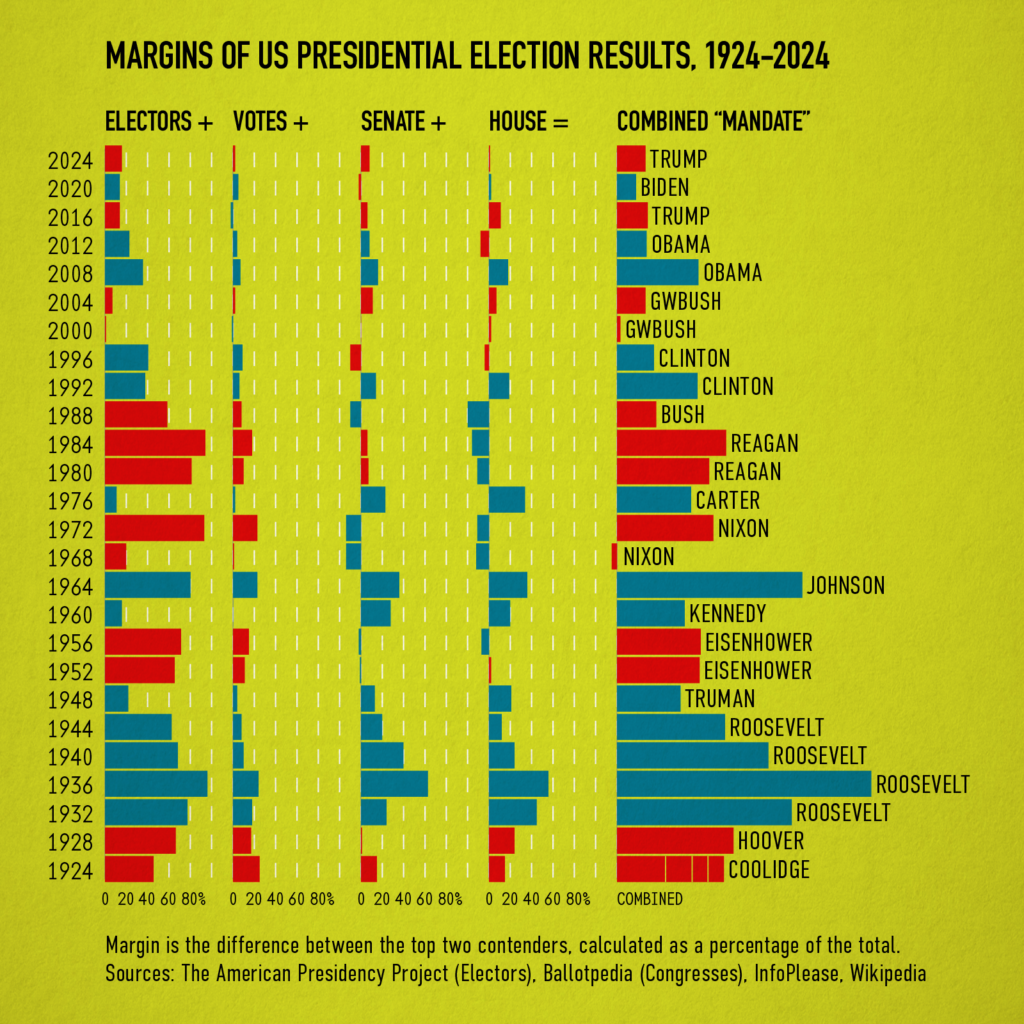
Franklin Roosevelt in 1936 scores highest, and Richard Nixon in 1968 is the only winner below zero.
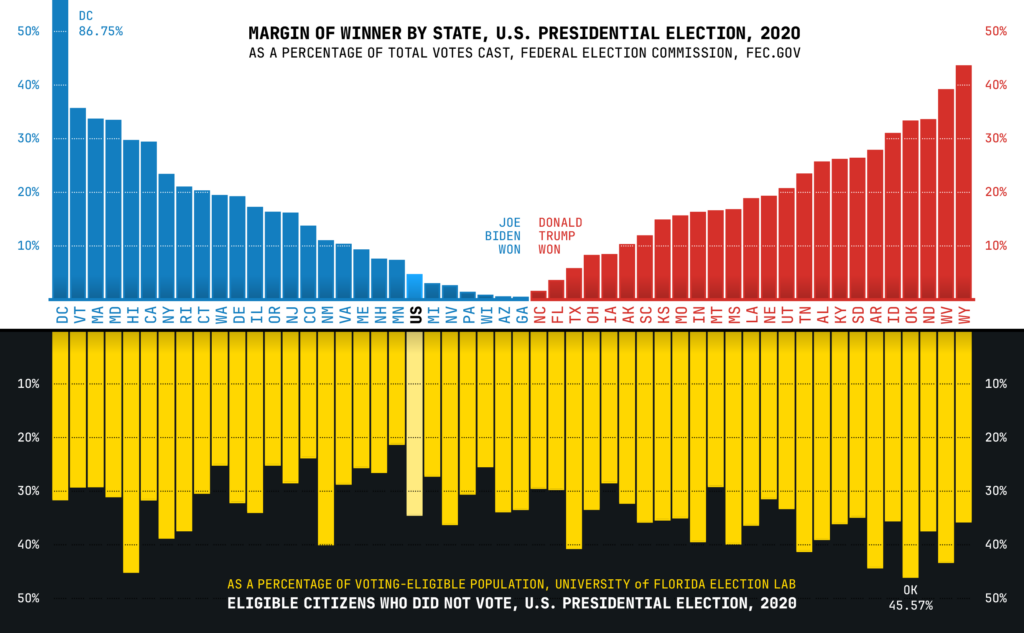
Turnout reached 66.4% of eligible citizens, the highest since 1900, yet about 81 million eligible Americans still did not vote.
Is this your work? Tell us about a credit, a correction or a better description, and we will update this page.
Give it a permanent page where people looking for your subject find it, with your name and a link to your site. Content marketers, agencies, designers and researchers all list here.