
Finance and Economy
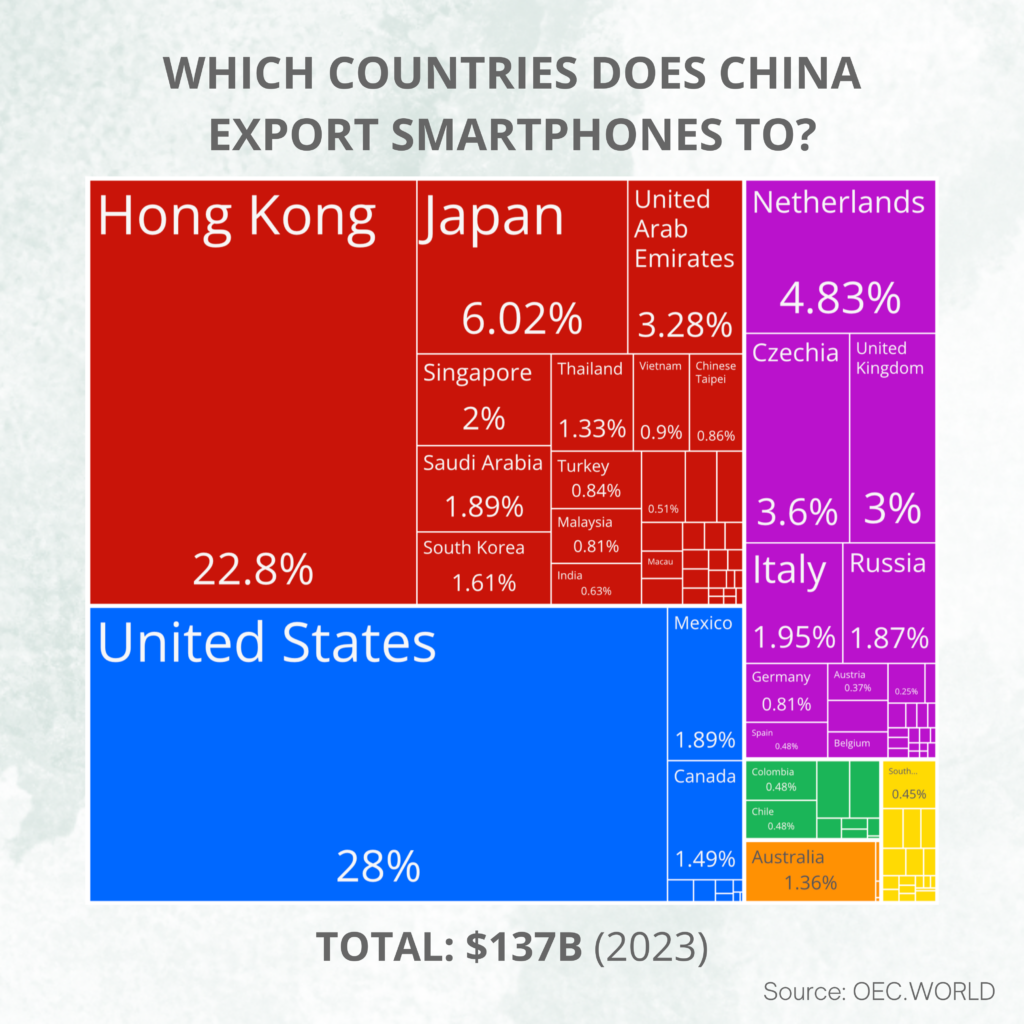
China Export Ranking 2023 for Smartphones, Top Destinations
China exported $3.38 trillion in total.

Creator on Reddit
RobinWheeliams, who goes by Wheelie on Reddit, posts original charts on world trade to communities such as r/Infographics, r/dataisbeautiful and r/EconomyCharts. The graphics map how China trades with other countries, from smartphone exports to car exports and Brazil's trade with China, the US and Europe, using data from the Observatory of Economic Complexity. Here you can see where China's smartphones end up.
China exported $3.38 trillion in total.
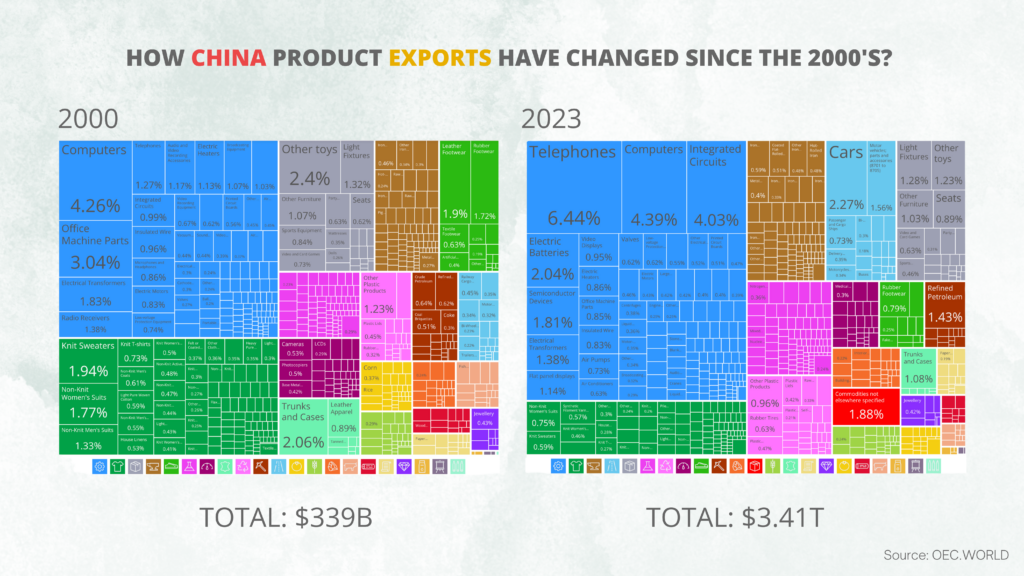
Machinery and electronics make up almost half of China's $3.59 trillion of exports, while clothing, shoes and toys have shrunk from about a third in 2000 to…
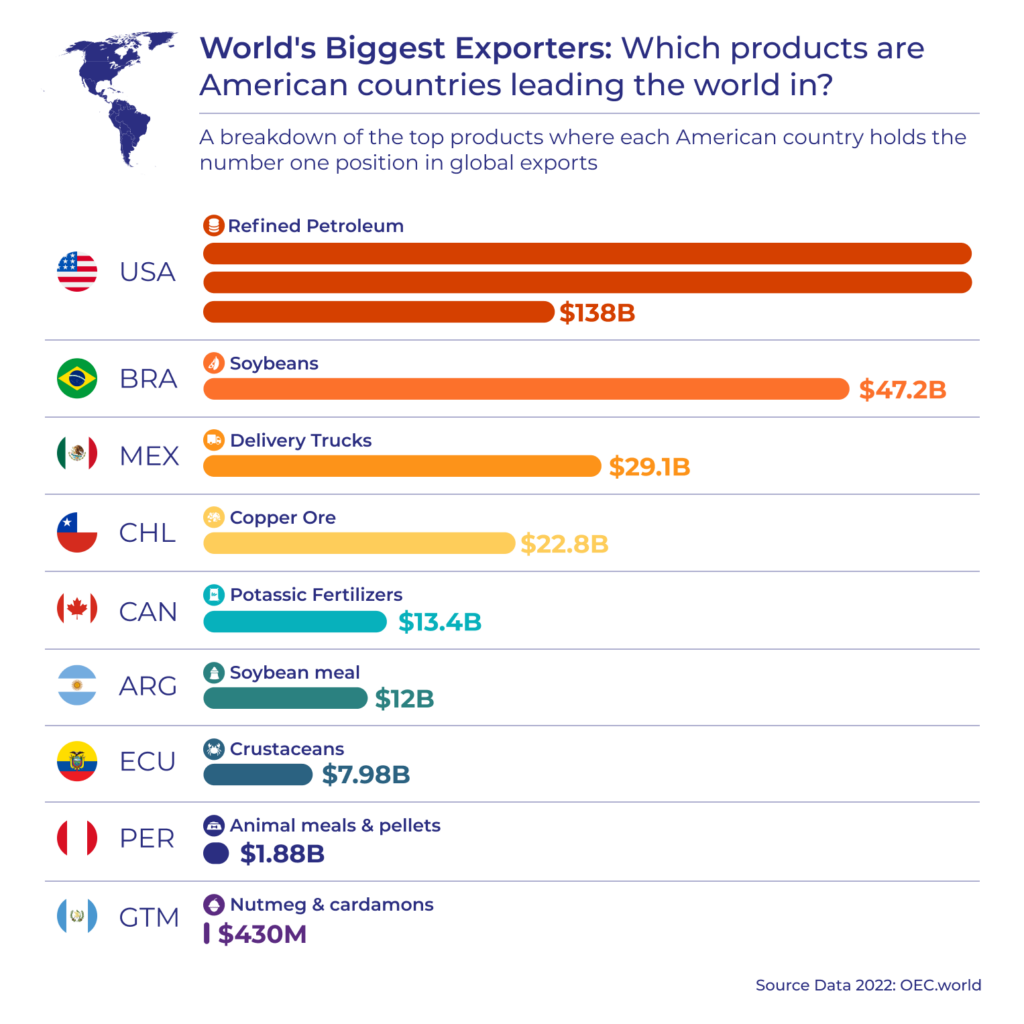
China sold $3.77 trillion of goods abroad in 2025, followed by the US at $2.19 trillion and Germany at $1.76 trillion, with the Netherlands and Hong Kong next.
Is this your work? Tell us about a credit, a correction or a better description, and we will update this page.
Give it a permanent page where people looking for your subject find it, with your name and a link to your site. Content marketers, agencies, designers and researchers all list here.