
Environment and Energy
US Energy Sources and Consumption by Sector
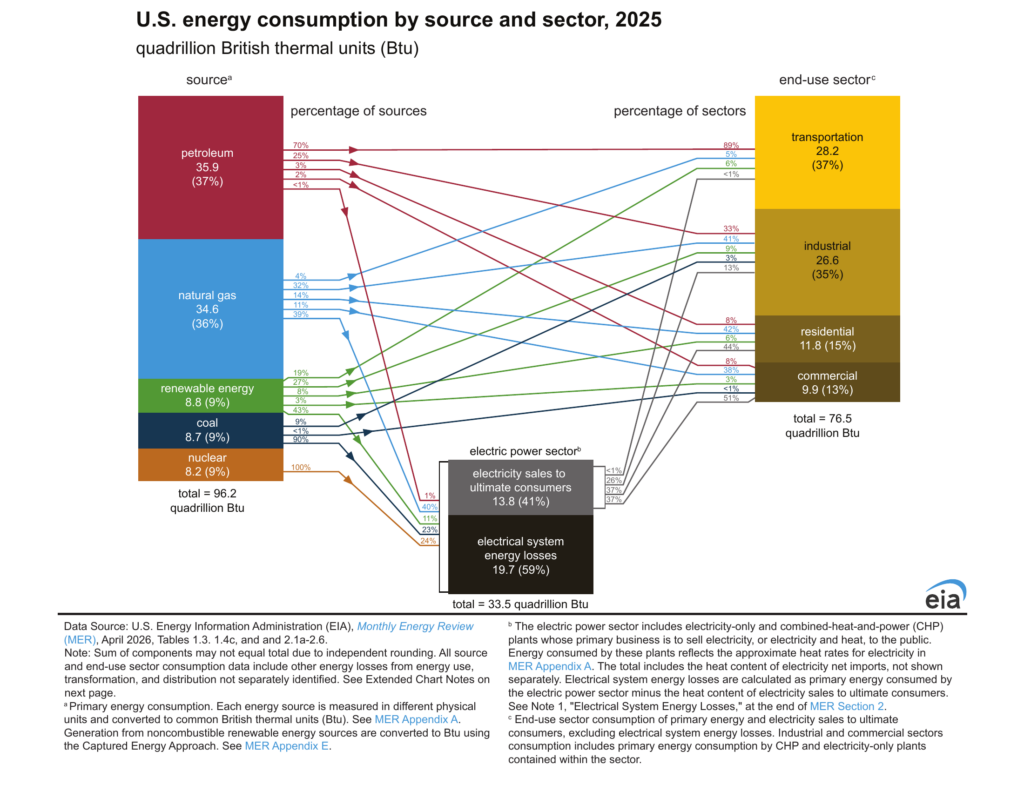
In 2025 the country used 96.5 quadrillion British thermal units (quads) of primary energy, and petroleum supplied 37% of it, natural gas 36%, renewables 9%,…

Infographic publisher
The U.S. Energy Information Administration, or EIA, is the federal government's independent authority for energy statistics and analysis, set up under the Department of Energy Organization Act in 1977. It collects and publishes data on US energy production, stocks, demand, imports, exports and prices, including the Monthly Energy Review. You will find its chart of how the US uses energy by source and sector in 2025.
Based in United States (Washington, D.C.)
In 2025 the country used 96.5 quadrillion British thermal units (quads) of primary energy, and petroleum supplied 37% of it, natural gas 36%, renewables 9%,…
Is this your work? Tell us about a credit, a correction or a better description, and we will update this page.
Give it a permanent page where people looking for your subject find it, with your name and a link to your site. Content marketers, agencies, designers and researchers all list here.