
Finance and Economy
US Tax Revenue 2024 and Federal Spending in One Chart
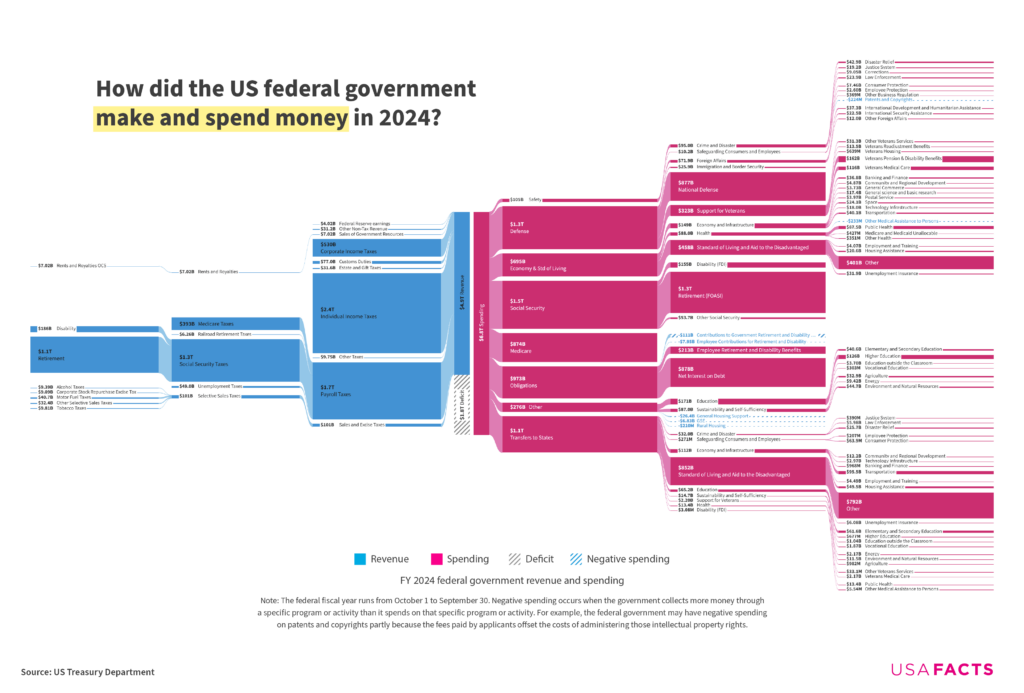
The government took in $4.9 trillion, mostly from individual income and payroll taxes, and spent $6.8 trillion, leaving a $1.8 trillion deficit.

Infographic publisher
USAFacts turns US government data into charts, graphics and plain articles. It draws only on federal, state and local government sources, analyses trends over time and covers subjects from public spending to jobs, literacy and libraries. It is free to use, carries no advertising and is privately funded by Steve Ballmer. Here you will find their charts comparing US states and professions.
Based in United States
The government took in $4.9 trillion, mostly from individual income and payroll taxes, and spent $6.8 trillion, leaving a $1.8 trillion deficit.
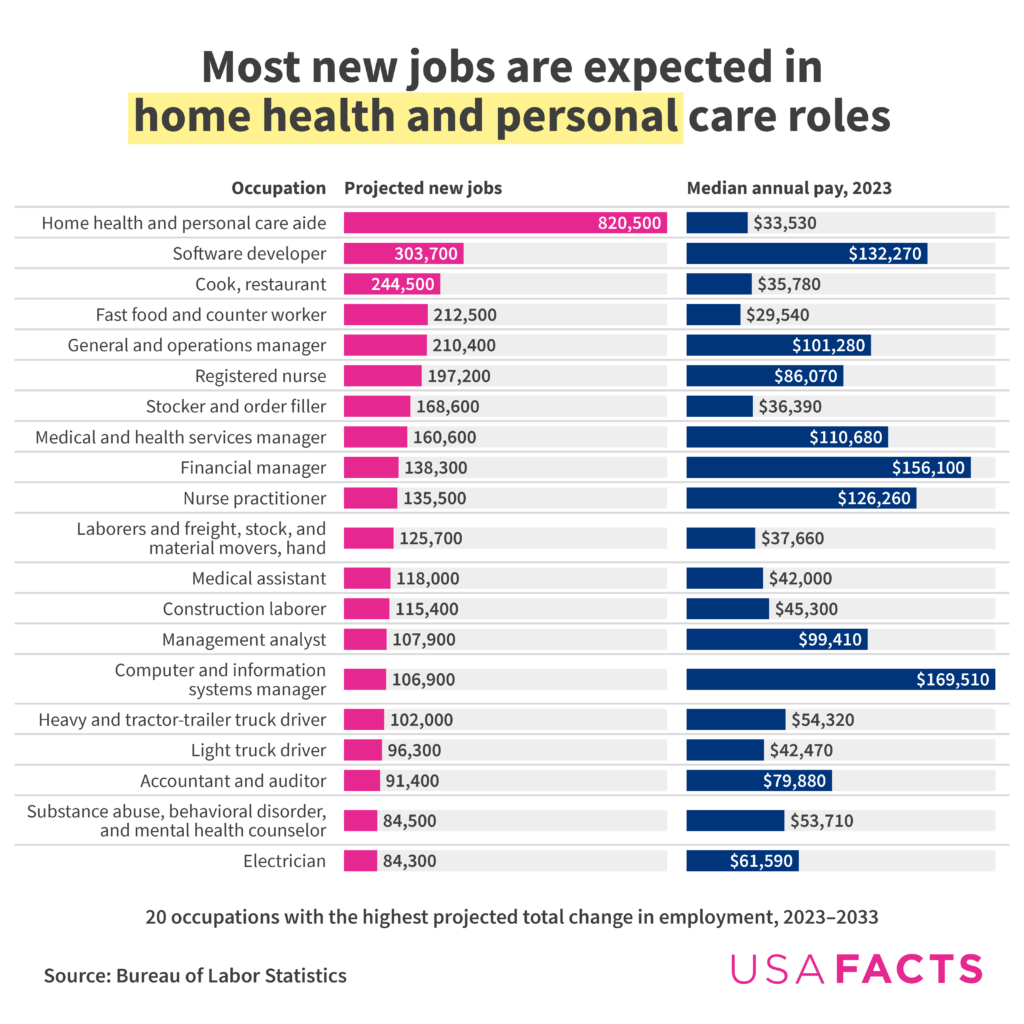
Home health and personal care aides lead with 820,500 new jobs, and five other health roles make the list, from registered nurses to nurse practitioners.

New Hampshire (278.9) and Minnesota (278.8) score highest, and New Mexico and Louisiana (251.5) lowest, against a US average of 263.5.
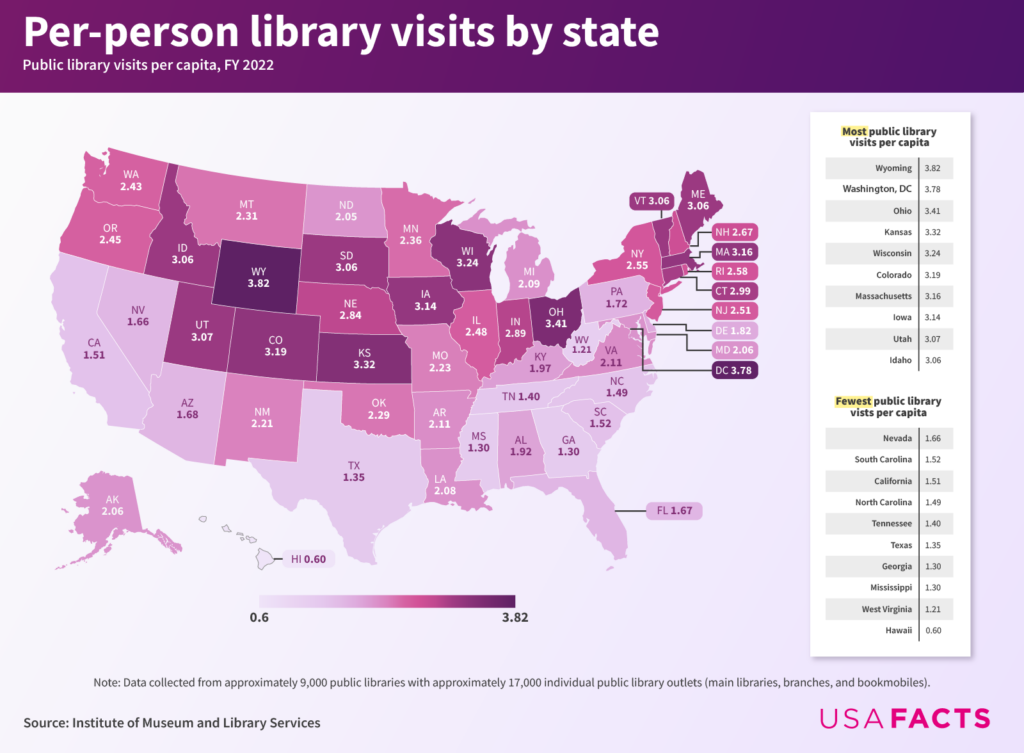
Wyoming had the most at 3.82 visits per resident, followed by Washington, DC and Ohio, while Hawaii had the fewest at 0.60.
Is this your work? Tell us about a credit, a correction or a better description, and we will update this page.
Give it a permanent page where people looking for your subject find it, with your name and a link to your site. Content marketers, agencies, designers and researchers all list here.