Where is Earth’s water?
The US Geological Survey puts the total amount of water on Earth at about 332.5 million cubic miles, or roughly 1,386 million cubic kilometres [2]. That includes the oceans, ice, groundwater, lakes, rivers, soil moisture and water vapour in the air. Almost all of it is salty:
| Where the water is | Volume (cubic km) | Share of all water |
|---|---|---|
| Oceans, seas and bays | 1,338,000,000 | 96.5% |
| Saline groundwater | 12,870,000 | 0.93% |
| Saline lakes | 85,400 | 0.006% |
| All fresh water | 35,028,000 | 2.5% |
The figures come from a 1993 estimate by the hydrologist Igor Shiklomanov, which the USGS still uses [2]. Nobody can measure the oceans or deep groundwater exactly, so treat them as good estimates rather than precise counts. The Water World infographic on this page, by David McCandless of Information is Beautiful, is built on the same USGS table [1][4].
How much of Earth’s water is fresh water?
About 2.5% of the world’s water is fresh, around 35 million cubic kilometres. Most of that is not in a form anyone can use [2]:
| Where the fresh water is | Share of fresh water |
|---|---|
| Ice caps, glaciers and permanent snow | 68.7% |
| Fresh groundwater | 30.1% |
| Ground ice and permafrost | 0.86% |
| Freshwater lakes | 0.26% |
| Soil moisture | 0.05% |
| Atmosphere | 0.04% |
| Swamps and marshes | 0.03% |
| Rivers | 0.006% |
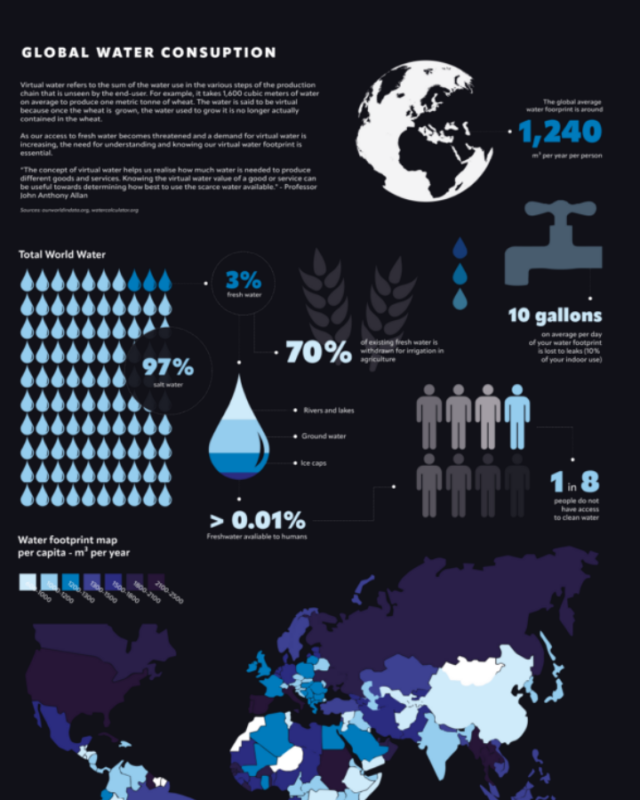
The infographic rounds these to 69%, 30%, 0.9%, 0.3% and so on, and shows rivers as 0.01%, which is the USGS figure of 0.006% rounded up. Most of the ice is in the Antarctic and Greenland ice sheets, so close to 99% of the world’s fresh water is either frozen or underground.
How much fresh water can people actually use?
The fresh water people draw on comes from rivers, lakes and the shallower parts of groundwater. Lakes and rivers together hold about 93,000 cubic kilometres, which is 0.27% of all fresh water and less than 0.01% of all the water on Earth (our sums from the USGS figures [2]). Add all fresh groundwater and the total still comes to under 0.8% of the world’s water, and a lot of that groundwater is too deep or too costly to pump.
The more useful number for water supply is how much is renewed each year. The FAO estimates that about 110,000 cubic kilometres of rain and snow fall on land each year. About 56% of that evaporates or is taken up by forests and natural land, 5% by rain-fed farming, and the remaining 39%, about 43,000 cubic kilometres a year, runs off into rivers and lakes or soaks down into aquifers [3]. That renewable flow is what a country can take without running down its reserves. Where people pump groundwater faster than rain refills it, the water table falls.
What do humans use most water for?
Farming, by a wide margin. The FAO’s AQUASTAT database splits water withdrawals into three uses, and at global level the shares are 69% agriculture, 19% industry and 12% municipal (homes, businesses and public supply) [3]. Agriculture includes irrigation, livestock and fish farming. The FAO adds that these global shares are pulled about by a few countries with very large withdrawals, and if you average country by country you get 59% agriculture, 23% municipal and 18% industry [3].
The split changes a lot by region [3]:
| Region | Agriculture | Municipal | Industry |
|---|---|---|---|
| World | 69% | 12% | 19% |
| South Asia | 91% | 7% | 2% |
| Western Europe | 5% | 23% | 73% |
In Western Europe most withdrawals go to industry, much of it cooling water for power stations, which is returned to rivers after use. In South Asia most water goes on irrigation.
The infographic gives a different split: agriculture 73%, reservoir evaporation 11%, diluting pollution 11%, industry 4% and urban use 2%. Its data sheet shows these come from an older estimate of about 2,560 cubic kilometres a year [4]. Including water lost from reservoirs and water needed to dilute pollution suggests it counts water used up rather than water withdrawn. That would explain why industry is only 4%: most water taken by industry goes back to rivers, whereas irrigation water mostly evaporates from fields and crops. If you need a current figure for withdrawals, use the FAO shares above.
How much water is in living things?
Very little. The USGS estimates biological water, the water held inside all plants, animals and microbes, at about 1,120 cubic kilometres [2]. That is about 0.003% of the world’s fresh water, roughly half the water in all the world’s rivers. The infographic shows organisms as 0.03% of fresh water, which is ten times too high; the infographic’s own data sheet works out the correct 0.003% [4].
The infographic then splits the water in living things between insects (35%), fungi (23%), bacteria (22%), archaea (11%) and smaller groups, with humans at 0.3%. Those shares come from estimates of the weight of all living matter on Earth in the data sheet, so they are shares of total biomass rather than measured amounts of water [4]. Biomass estimates have moved on a lot since then. A 2018 study in PNAS put plants at about 82% of all living carbon on Earth and bacteria at about 13%, with all animals at about 0.4% [5]. The point the infographic makes still holds: people hold a tiny share of the planet’s water.
Why fresh water is scarce in many places
The world as a whole uses only a small part of the fresh water renewed each year, but it is not spread evenly. Rain falls in the wrong places or the wrong season, rivers cross borders, and the cheapest groundwater gets used first. The World Health Organization says more than 2 billion people lived in water-stressed countries in 2021 [6]. In 2022, 73% of the world’s population (6 billion people) used a safely managed drinking water service, one on the premises, available when needed and free from contamination, which left 2.2 billion people without one [6].
Because farming uses most of the water, changes there make the biggest difference. Drip irrigation, lining canals, choosing crops that suit the local climate and cutting food waste save far more water than anything a household can do, although fixing leaks and using less at home still helps where supplies are tight.
Questions about global water distribution
What percentage of Earth’s water is fresh water?
About 2.5%, according to the US Geological Survey. The oceans hold about 96.5% and saline groundwater and salt lakes most of the rest. Of the fresh water, about 69% is frozen in ice caps, glaciers and permanent snow and about 30% is underground [2].
What percentage of Earth’s water is drinkable?
Less than 1% of the world’s water is liquid fresh water in lakes, rivers and groundwater, and lakes and rivers alone hold under 0.01% of it (our sums from USGS figures [2]). Even that water often needs treating before it is safe to drink. Sea water can be made drinkable through desalination, but it takes a lot of energy.
How much water is there on Earth?
About 1,386 million cubic kilometres (332.5 million cubic miles), of which about 35 million cubic kilometres is fresh water [2].
Where is most of the world’s fresh water?
In ice. About 68.7% of fresh water is in ice caps, glaciers and permanent snow, mostly in Antarctica and Greenland, and about 30% is groundwater. Lakes hold 0.26% and rivers 0.006% [2].
What uses the most water in the world?
Agriculture, mainly irrigation. It accounts for 69% of global freshwater withdrawals, against 19% for industry and 12% for homes and public supply [3]. Measured by water actually used up rather than withdrawn, farming’s share is higher still.
Sources
- Information is Beautiful, Water World, the distribution of all the water in all the world, David McCandless, design and research, with research by Miriam Quick, from the book Knowledge is Beautiful (HarperCollins 2014).
- US Geological Survey, Where is Earth’s water? (estimates from Igor Shiklomanov, 1993).
- FAO AQUASTAT, Water use.
- Information is Beautiful, Water World data sheet (checked 6 November 2026).
- Bar-On, Phillips and Milo, The biomass distribution on Earth, PNAS, 2018.
- World Health Organization, Drinking-water fact sheet.
Last reviewed 6 November 2026