
Finance and Economy
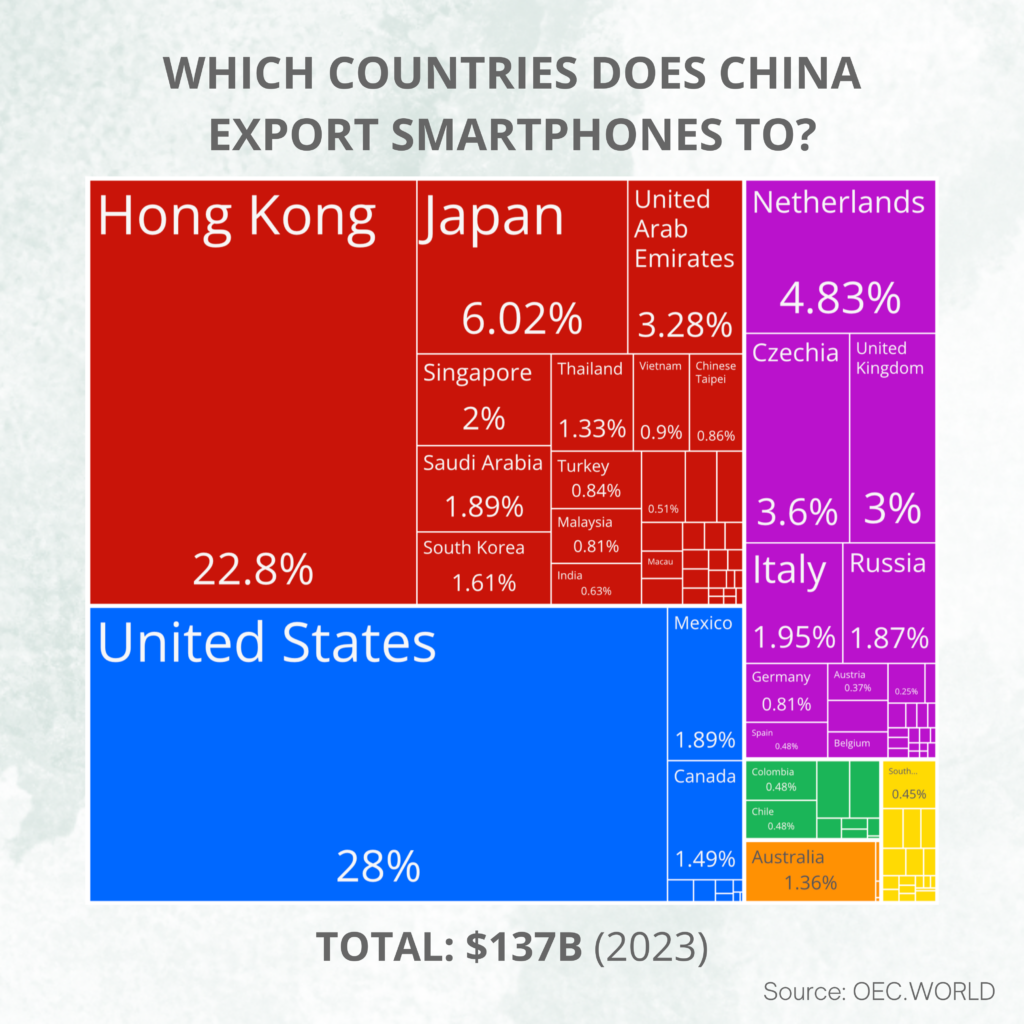
China Export Ranking 2023 for Smartphones, Top Destinations
China exported $3.38 trillion in total.
476 reviewed infographics. Search them, or narrow the list by topic and sort it the way you want.
China exported $3.38 trillion in total.
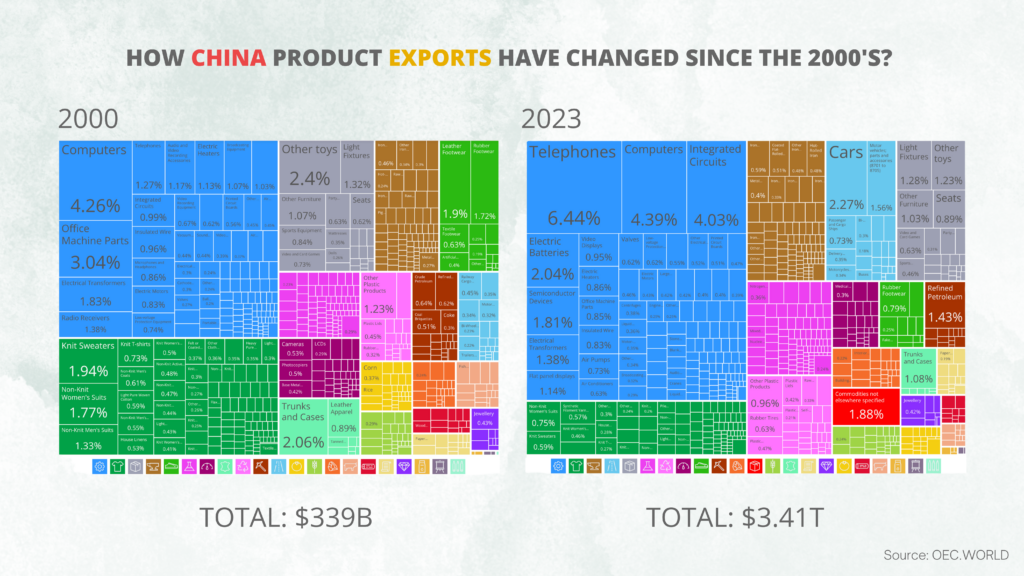
Machinery and electronics make up almost half of China's $3.59 trillion of exports, while clothing, shoes and toys have shrunk from about a third in 2000 to…
China sold $3.77 trillion of goods abroad in 2025, followed by the US at $2.19 trillion and Germany at $1.76 trillion, with the Netherlands and Hong Kong next.
Every topic page starts with a short guide to the subject.




Give it a permanent page where people looking for your subject find it, with your name and a link to your site. Content marketers, agencies, designers and researchers all list here.