

Finance and Economy
Digitally Delivered Services Exports Reached $4.3 Trillion
Exports grew from about $1.0 trillion to $4.3 trillion, an average of 8.2% a year.
476 reviewed infographics. Search them, or narrow the list by topic and sort it the way you want.
Exports grew from about $1.0 trillion to $4.3 trillion, an average of 8.2% a year.

Since the 2018 trade war the deficit with China has fallen from $402 billion to $287 billion a year, while the deficit with other countries nearly doubled…

On the figures in this chart, based on Resource Generation's class guide, the working class is the largest at about 40% of people, a middle-class earner…
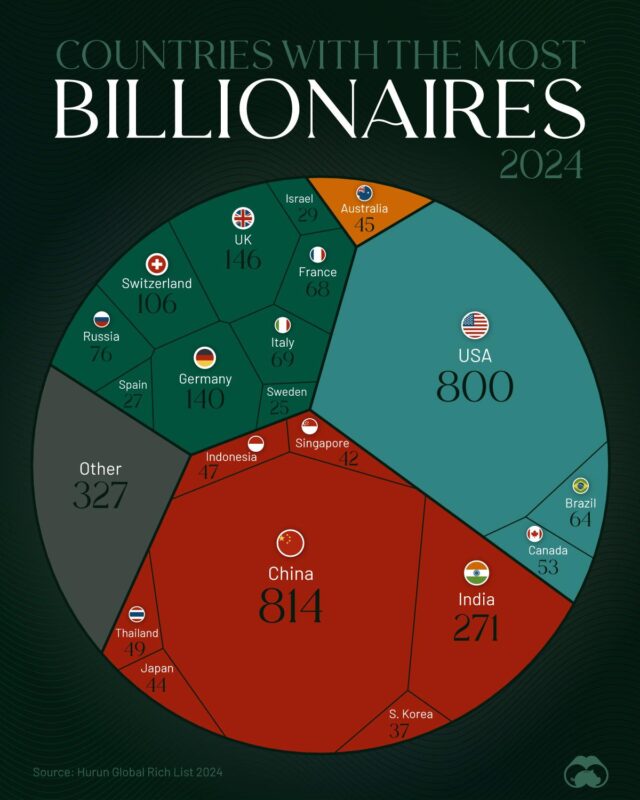
China leads with 814 billionaires, just ahead of the USA with 800, followed by India with 271, the UK with 146 and Germany with 140.

In July 2024, when this chart was made, Scott led at $327 million.
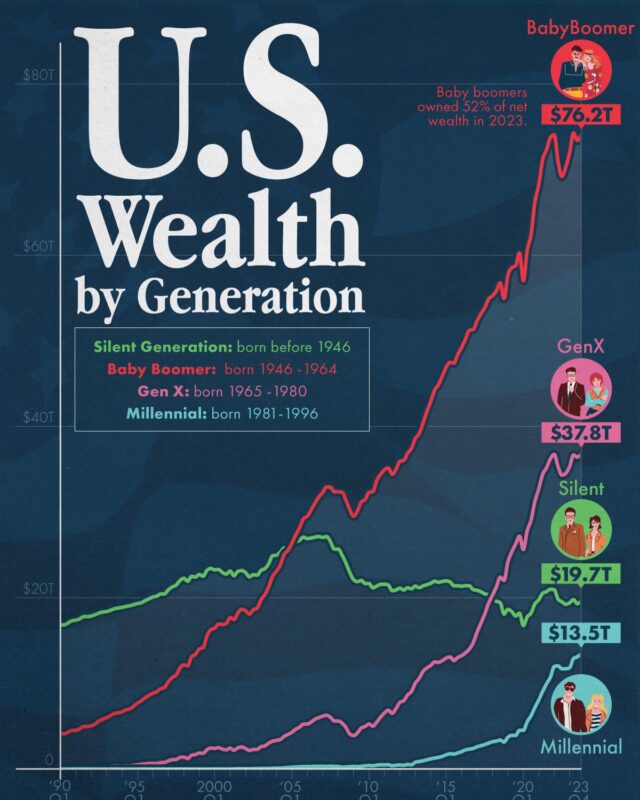
At the end of 2023 Baby Boomers held $76.2 trillion, 52% of the country's net wealth, ahead of Gen X at $37.8 trillion, the Silent Generation at $19.7…
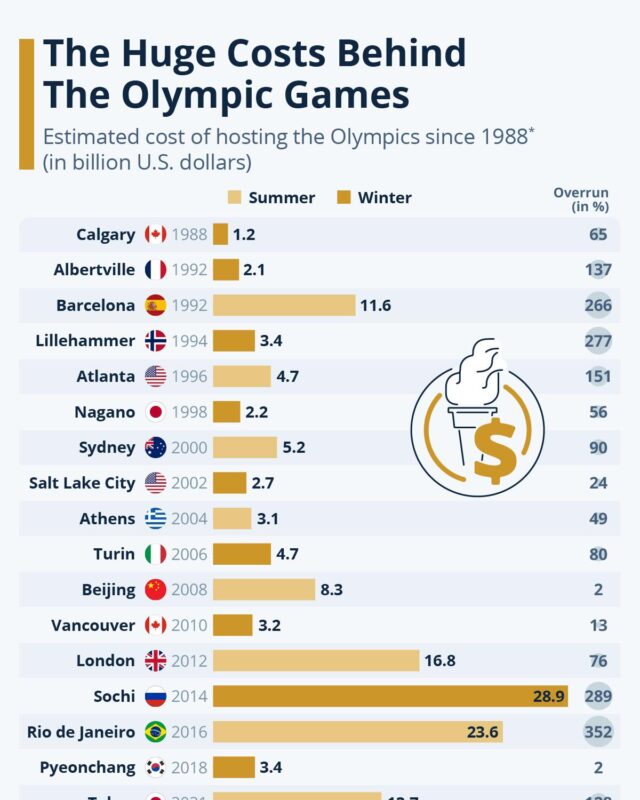
Sochi 2014 cost the most at US$28.9 billion, Rio 2016 overran by 352%, and Paris 2024 cost US$8.7 billion.

Kuala Lumpur at RM3,927 to Kelantan at RM1,600, plus Singapore and Brunei.

Antimatter tops it at $62.5 trillion a gram, followed by rare isotopes, lab-made molecules and gemstones such as painite and red beryl.

Crude petroleum (5.8%), aircraft parts (5.61%) and refined petroleum (5.59%) are the largest products, and Canada (17.5%), Mexico (16%) and China (7.32%)…

France collects the most tax relative to its economy, 46% of GDP, followed by Italy and Germany.

Nationally a year of income covers 20% of a home, about five years of income.

In an Ipsos survey of 23,721 adults, 51% expected a stronger global economy than in 2024 and 49% a weaker one.
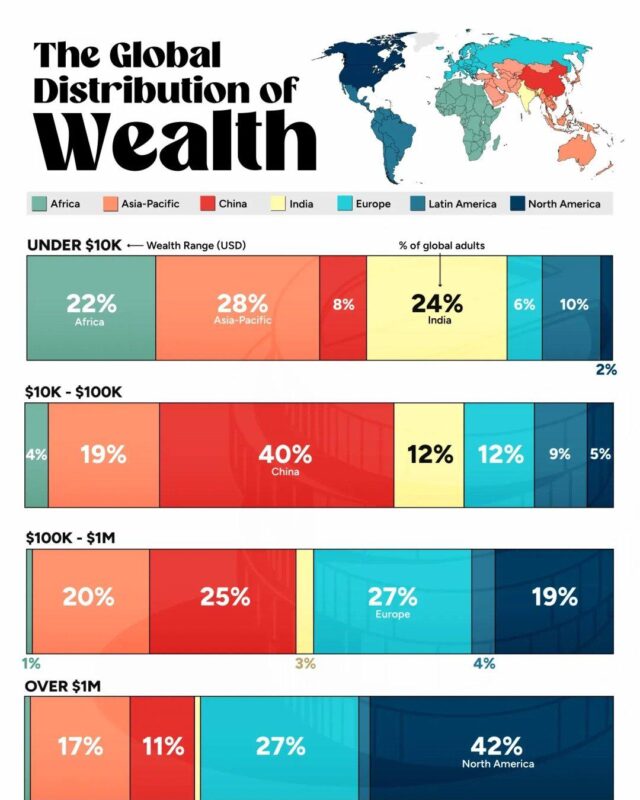
North America is home to 42% of the world's adults with more than $1 million, while Africa, Asia-Pacific and India together account for 74% of adults with…

Crude oil leads at $5.59 billion, followed by gold, cut flowers and coffee at about $1.5 billion each.

In the 12 months to November 2024 the US exported 4.17 million barrels a day and imported 6.58 million, a deficit of 2.40 million.

Between December 2021 and December 2024, China's M2 grew 15.1% while the US figure was almost unchanged at 0.1%.

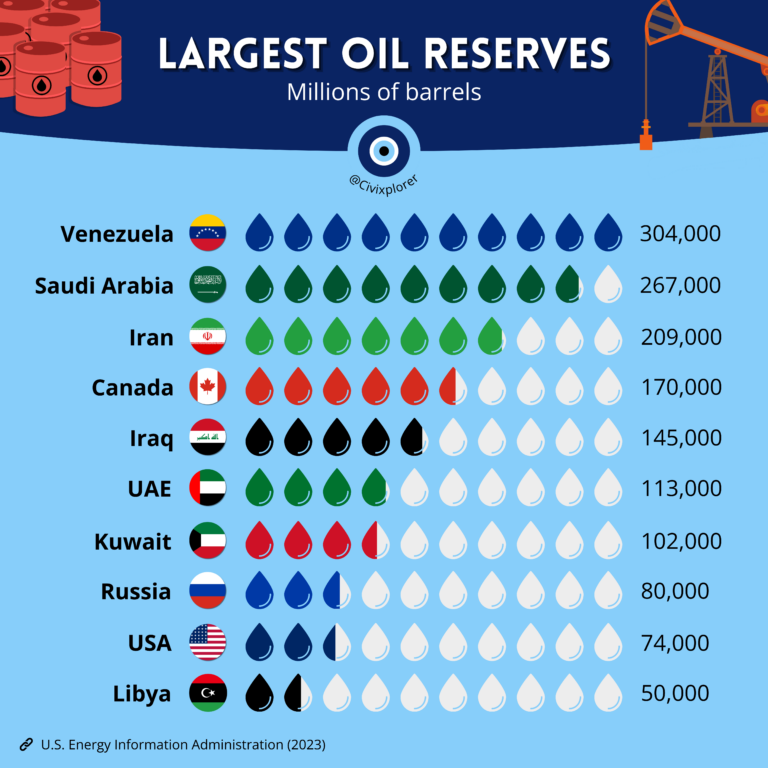
Imports grew from about 1.4 million to 11.1 million barrels a day, and Russia became the largest supplier at 2.19 million barrels a day, ahead of Saudi…

In the 12 months to November 2024 the EU exported €529 billion to the United States and imported €336 billion, a €193 billion surplus.

Taxes and levies made up 11.7 cents of that.

It supplied about 72% of real GDP growth from 1990 to 2024 and added to growth in 33 of those 35 years.

The government took in $4.9 trillion, mostly from individual income and payroll taxes, and spent $6.8 trillion, leaving a $1.8 trillion deficit.

China bought 4,057 million barrels of crude that year, about 11.1 million barrels a day.

Medians range from $35,308 for workers aged 16 to 19 to $98,488 for those with an advanced degree.
Every topic page starts with a short guide to the subject.















Give it a permanent page where people looking for your subject find it, with your name and a link to your site. Content marketers, agencies, designers and researchers all list here.