Jobs and Careers
Working Hours vs Salary by Country
In OECD data for 2024, the countries with the highest average wages, such as Luxembourg, Switzerland, Denmark and Germany, work some of the shortest years,…
489 reviewed infographics. Search them, or narrow the list by topic or type and sort it the way you want.
In OECD data for 2024, the countries with the highest average wages, such as Luxembourg, Switzerland, Denmark and Germany, work some of the shortest years,…
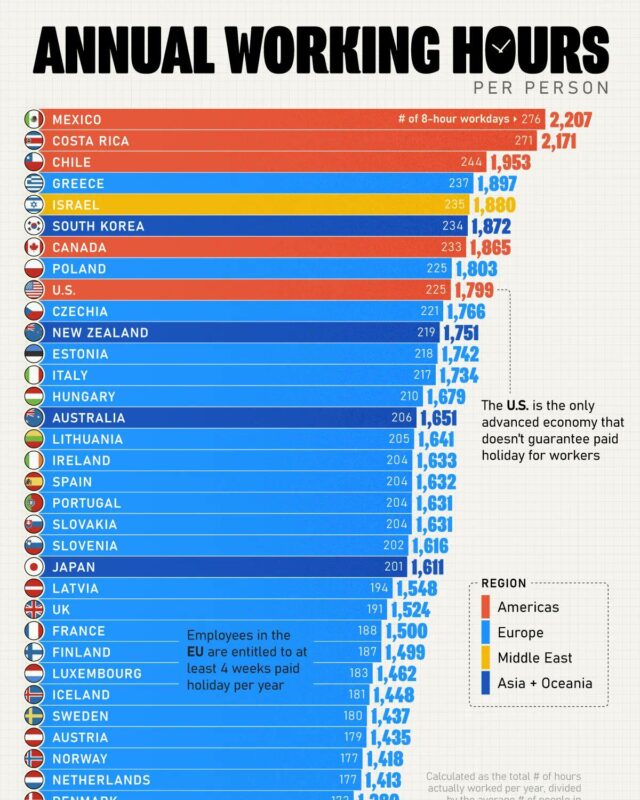
On the latest OECD figures, for 2025, people in work in Mexico put in 2,205 hours a year, the most of any OECD country, followed by Costa Rica at 2,183 and…
Every topic page starts with a short guide to the subject.