How have US households changed since 1960?
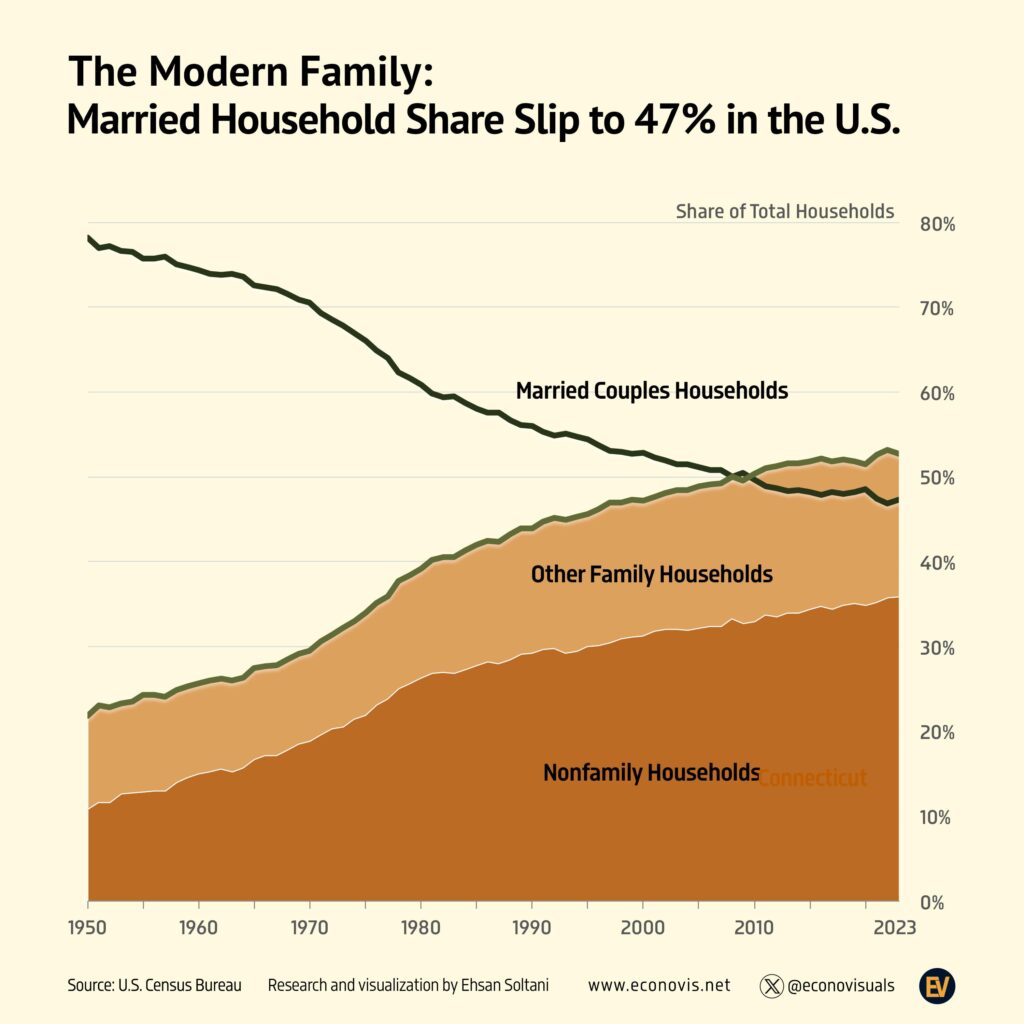
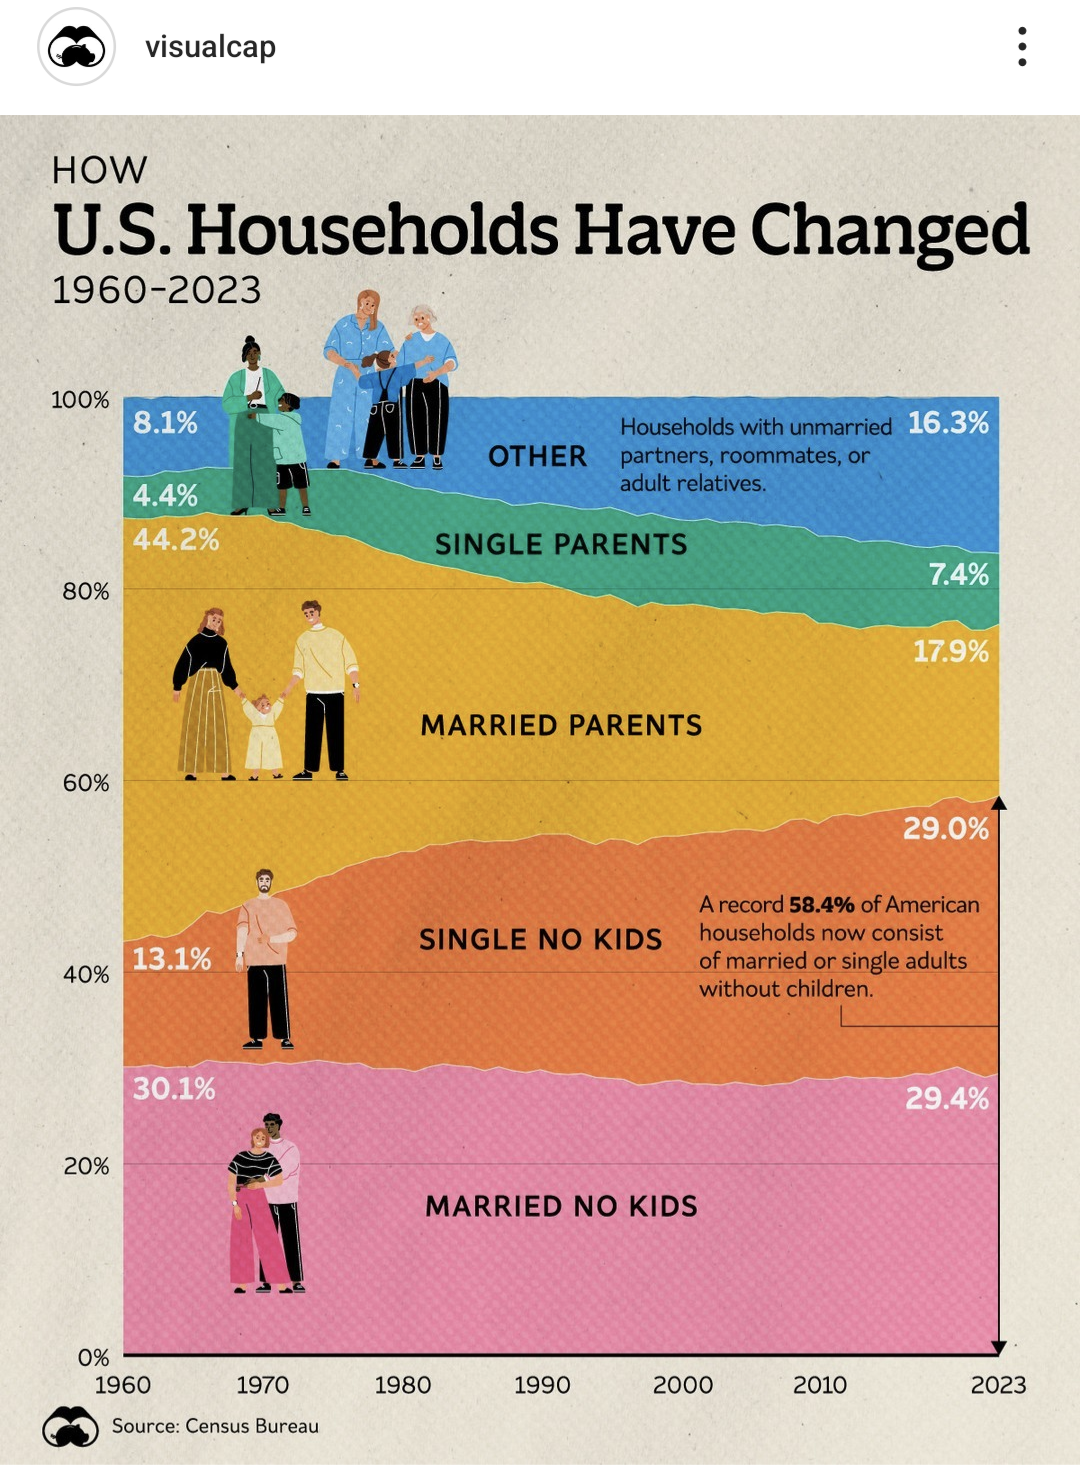
US households have changed from mostly married parents to mostly adults without children. In 1960 married couples with children made up 44.2% of households. By 2023 that had fallen to 17.9%, while people living alone rose from 13.1% to 29.0%. A record 58.4% of households in 2023 were married couples or single adults with no children at home [1][2].
The figures come from the Census Bureau’s Current Population Survey, grouped by USAFacts into five household types, and are shown in the infographic by Visual Capitalist [1][2]. Over the same period the number of households more than doubled, from 52.8 million in 1960 to 134.8 million in 2025, and the average household shrank from 3.33 people to 2.50 [3][4].
US household types in 1960 and 2023
| Household type | 1960 | 2023 | Change (points) |
|---|---|---|---|
| Married couple, no children at home | 30.1% | 29.4% | -0.7 |
| Single adult, no children (mostly people living alone) | 13.1% | 29.0% | +15.9 |
| Married couple with children | 44.2% | 17.9% | -26.3 |
| Single parent | 4.4% | 7.4% | +3.0 |
| Other (unmarried partners, roommates, adult relatives) | 8.1% | 16.3% | +8.2 |
Shares of all US households [1][2]. “Children” here means children living in the household, so a couple whose children have grown up and moved out counts as a household without children.
Married couples without children at home have stayed close to 30% of households for more than 60 years. Almost all of the change has come from the fall in married parents and the rise in people living alone and in “other” arrangements such as cohabiting couples and house shares.
The change decade by decade
Visual Capitalist published the yearly series behind the chart [2]. This table shows the start of each decade and the latest year.
| Year | Married, no children | Single, no children | Married parents | Single parents | Other |
|---|---|---|---|---|---|
| 1960 | 30.1% | 13.1% | 44.2% | 4.4% | 8.1% |
| 1970 | 30.3% | 17.1% | 40.3% | 5.2% | 7.1% |
| 1980 | 29.9% | 22.7% | 30.9% | 7.5% | 9.0% |
| 1990 | 29.8% | 24.6% | 26.3% | 8.3% | 11.0% |
| 2000 | 28.7% | 25.5% | 24.1% | 8.9% | 12.7% |
| 2010 | 28.8% | 26.7% | 20.9% | 9.1% | 14.5% |
| 2023 | 29.4% | 29.0% | 17.9% | 7.4% | 16.3% |
The biggest shift came in the 1970s, when the share of married parents fell from 40.3% to 30.9% and the share of single adults rose from 17.1% to 22.7% [2]. The decline in married parents has continued in every decade since, though more slowly. Single parents peaked at 9.5% of households in 1997 and have since fallen back to 7.4% [2].
Why American households have changed
Several long-term trends sit behind the numbers. People are marrying later or not at all. The median age at first marriage has risen to 30.8 for men and 28.4 for women, from 23.5 and 21.1 in 1975 [5]. Married couples were 74% of all households in 1960 (our arithmetic from [3]) and fewer than half (47%) in 2025 [5].
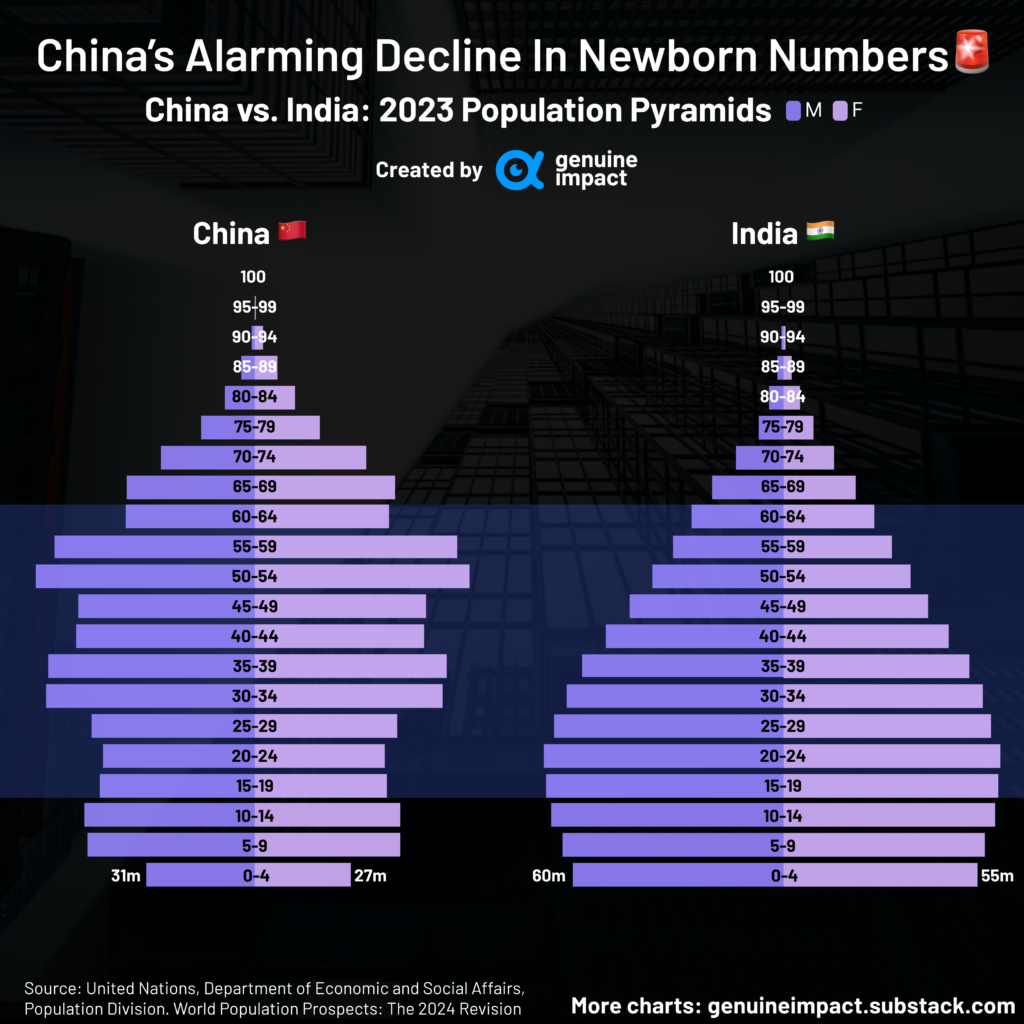
Americans are also having fewer children. Visual Capitalist notes that the US fertility rate fell to a record low of about 1.6 children per woman in 2023, below the replacement level of 2.1 [1][2]. Even married couples are less likely to have children at home. In 1975, 54% of married-couple households included their own children under 18, against about 37% in 2025 [5].
Choice plays a part as well. Among Americans under 50 without children, 57% say they simply do not want them, and 36% point to the cost of raising children, according to survey figures Visual Capitalist cites [1].
The population is older too. More than one in four householders is now 65 or over, against one in five in 1975 [5]. Older couples whose children have left home, and widowed people living alone, add to the number of households without children.
The rise of living alone
Living alone is the fastest-growing household type. There were 6.9 million one-person households in 1960 and 39.7 million in 2025, 29% of all households [3][5]. One-person households are now more common than households of three, four or five people, and second only to two-person households (46.5 million) [4]. Large households have become rare. Households of five or more people fell from 22.6% of the total in 1960 to 8.8% in 2025 (our arithmetic from [4]).
Questions about how US households have changed
What percentage of US households are married couples with children?
About 17.9% in 2023, down from 44.2% in 1960 [1][2].
What is the most common household type in the US?
Married couples without children at home (29.4% in 2023) and people living alone (29.0%) are now almost level as the most common types. In 1960 married parents were the most common by far [1][2].
How many households are there in the US?
About 134.8 million in 2025, up from 52.8 million in 1960 [3].
What is the average household size in the US?
2.50 people in 2025, down from 3.33 in 1960 [4].
What is the difference between a household and a family?
A household is everyone who lives in one home, including people living alone and unrelated roommates. A family household is one where at least one other person is related to the householder by birth, marriage or adoption. In 2025, 86.0 million of the 134.8 million US households were family households [3].
Do more than half of US households have no children?
Yes. In 2023 a record 58.4% were married couples or single adults with no children at home, and households without children have outnumbered those with children since 2014 [1][2].
Sources
- Dorothy Neufeld, Visual Capitalist, How American Households Have Changed Over Time (1960 to 2023), 6 November 2024.
- Visual Capitalist on Voronoi, Over Half of Households in the U.S. Don’t Have Kids, 3 November 2024, with the yearly data.
- US Census Bureau, Table HH-1, Households by Type, 1940 to Present.
- US Census Bureau, Historical Households Tables (Tables HH-4 and HH-6, household size).
- US Census Bureau, Census Bureau Releases New Estimates on America’s Families and Living Arrangements, 2 December 2025.
Last reviewed 11 November 2026