
Finance and Economy
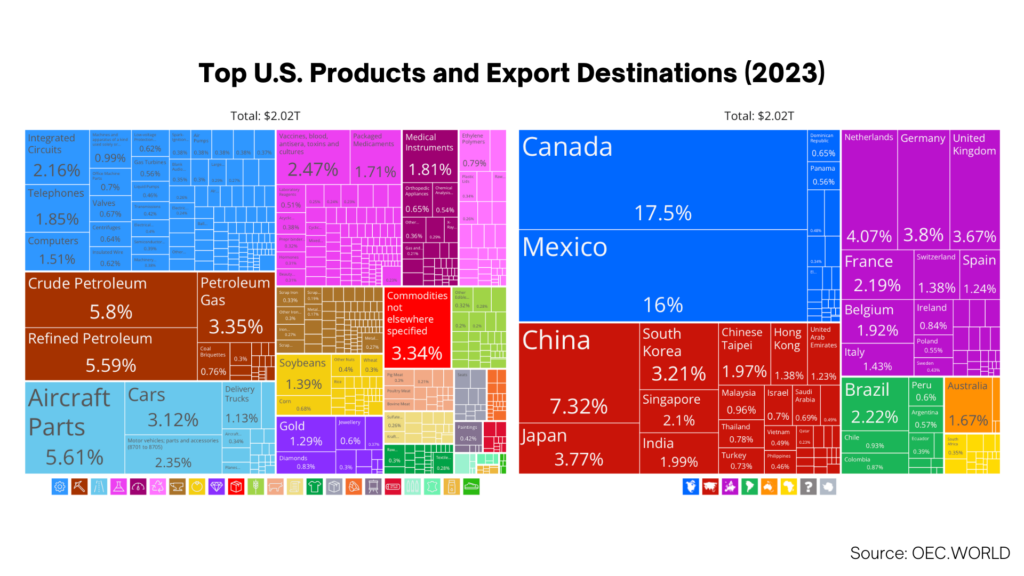
Top US Exports and Export Destinations in 2023
Crude petroleum (5.8%), aircraft parts (5.61%) and refined petroleum (5.59%) are the largest products, and Canada (17.5%), Mexico (16%) and China (7.32%)…
476 reviewed infographics. Search them, or narrow the list by topic and sort it the way you want.
Crude petroleum (5.8%), aircraft parts (5.61%) and refined petroleum (5.59%) are the largest products, and Canada (17.5%), Mexico (16%) and China (7.32%)…
Every topic page starts with a short guide to the subject.







Give it a permanent page where people looking for your subject find it, with your name and a link to your site. Content marketers, agencies, designers and researchers all list here.