Education and Learning
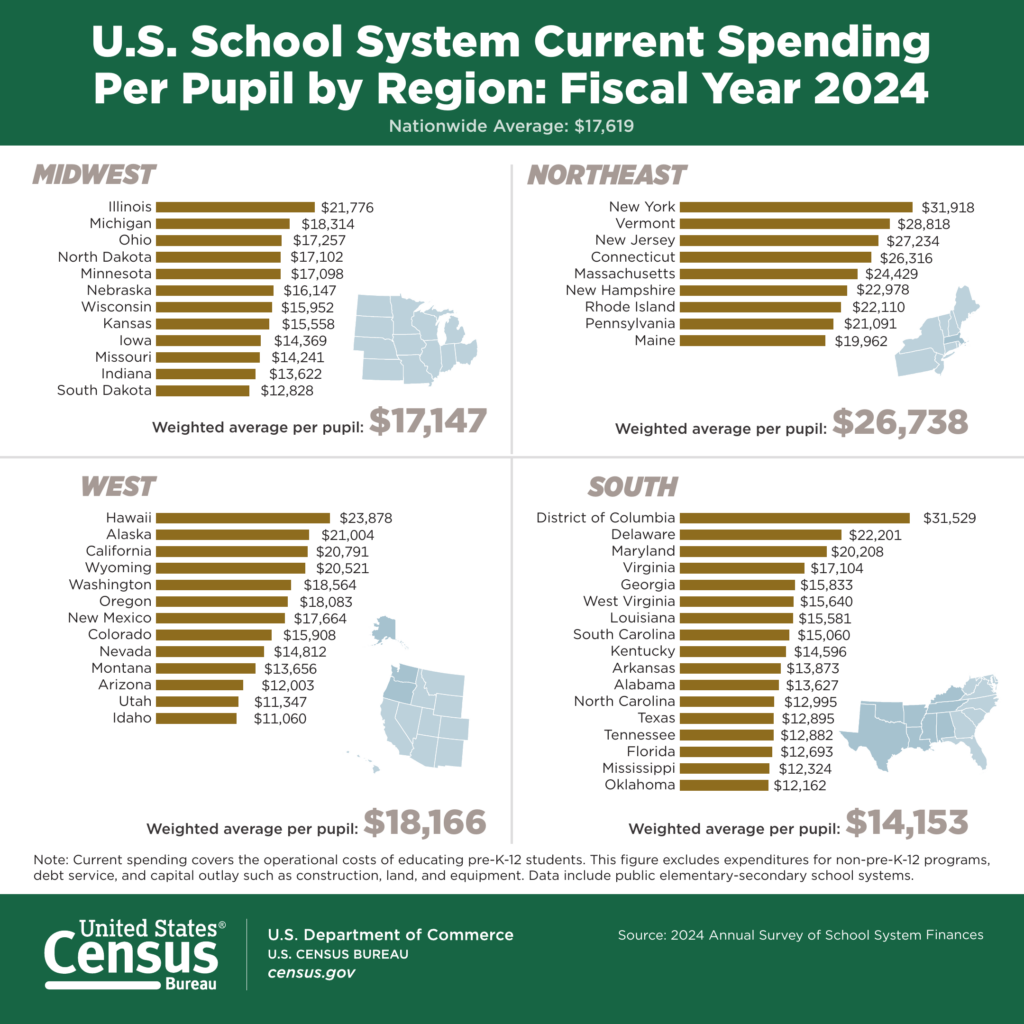
Per Pupil Spending by State in US Public Schools
New York spent the most at $31,918 per pupil and Idaho the least at $11,060, so a child in a New York public school had almost three times as much spent on…
489 reviewed infographics. Search them, or narrow the list by topic or type and sort it the way you want.
New York spent the most at $31,918 per pupil and Idaho the least at $11,060, so a child in a New York public school had almost three times as much spent on…

Wyoming, North Dakota and Alaska have the cheapest top prices, all around $23,000 to $25,500.
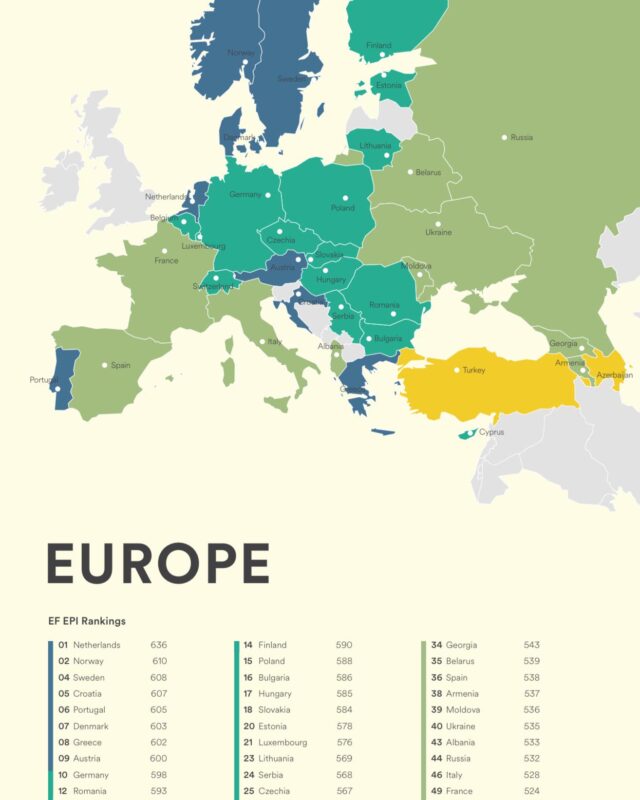
On the 2025 EF English Proficiency Index, the 12 highest scoring countries are all European, led by the Netherlands with 624, then Croatia, Austria, Germany…

Worldwide, UNESCO counts primary age as roughly 6 to 11, and children of that age are the most likely to be in school.
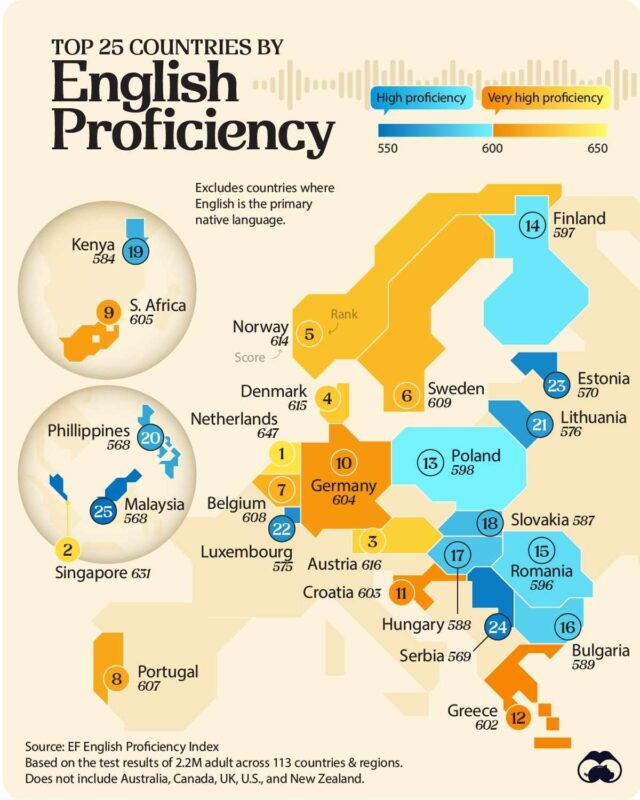
It is first in the EF English Proficiency Index 2025 with a score of 624, ahead of Croatia (617), Austria (616), Germany (615) and Norway (613).

New Hampshire (278.9) and Minnesota (278.8) score highest, and New Mexico and Louisiana (251.5) lowest, against a US average of 263.5.

Massachusetts and Minnesota are close behind New Hampshire, Louisiana and Mississippi are near the bottom, and every state sits inside the average IQ range…

The world rate was 43.6% in 2024.

Wyoming had the most at 3.82 visits per resident, followed by Washington, DC and Ohio, while Hawaii had the fewest at 0.60.
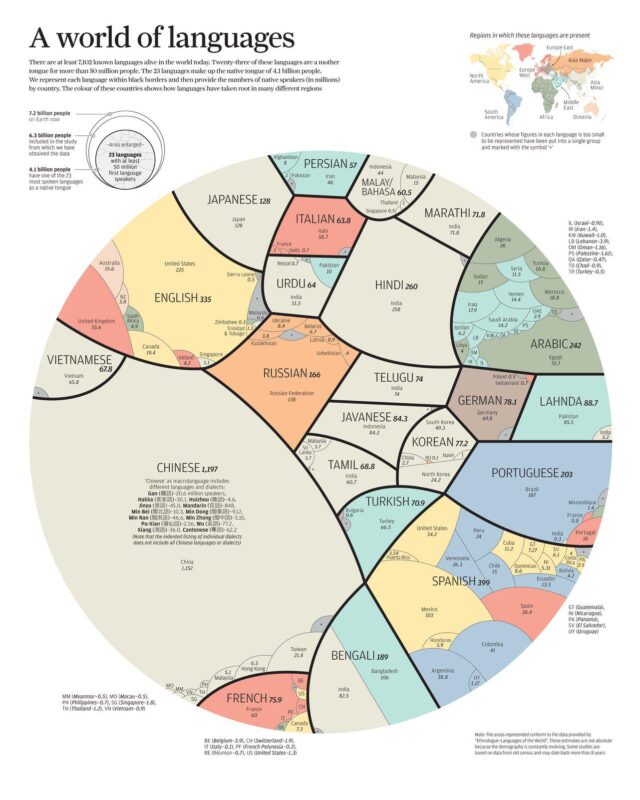
The 20 largest are the native tongue of more than 3.7 billion people.
Every topic page starts with a short guide to the subject.