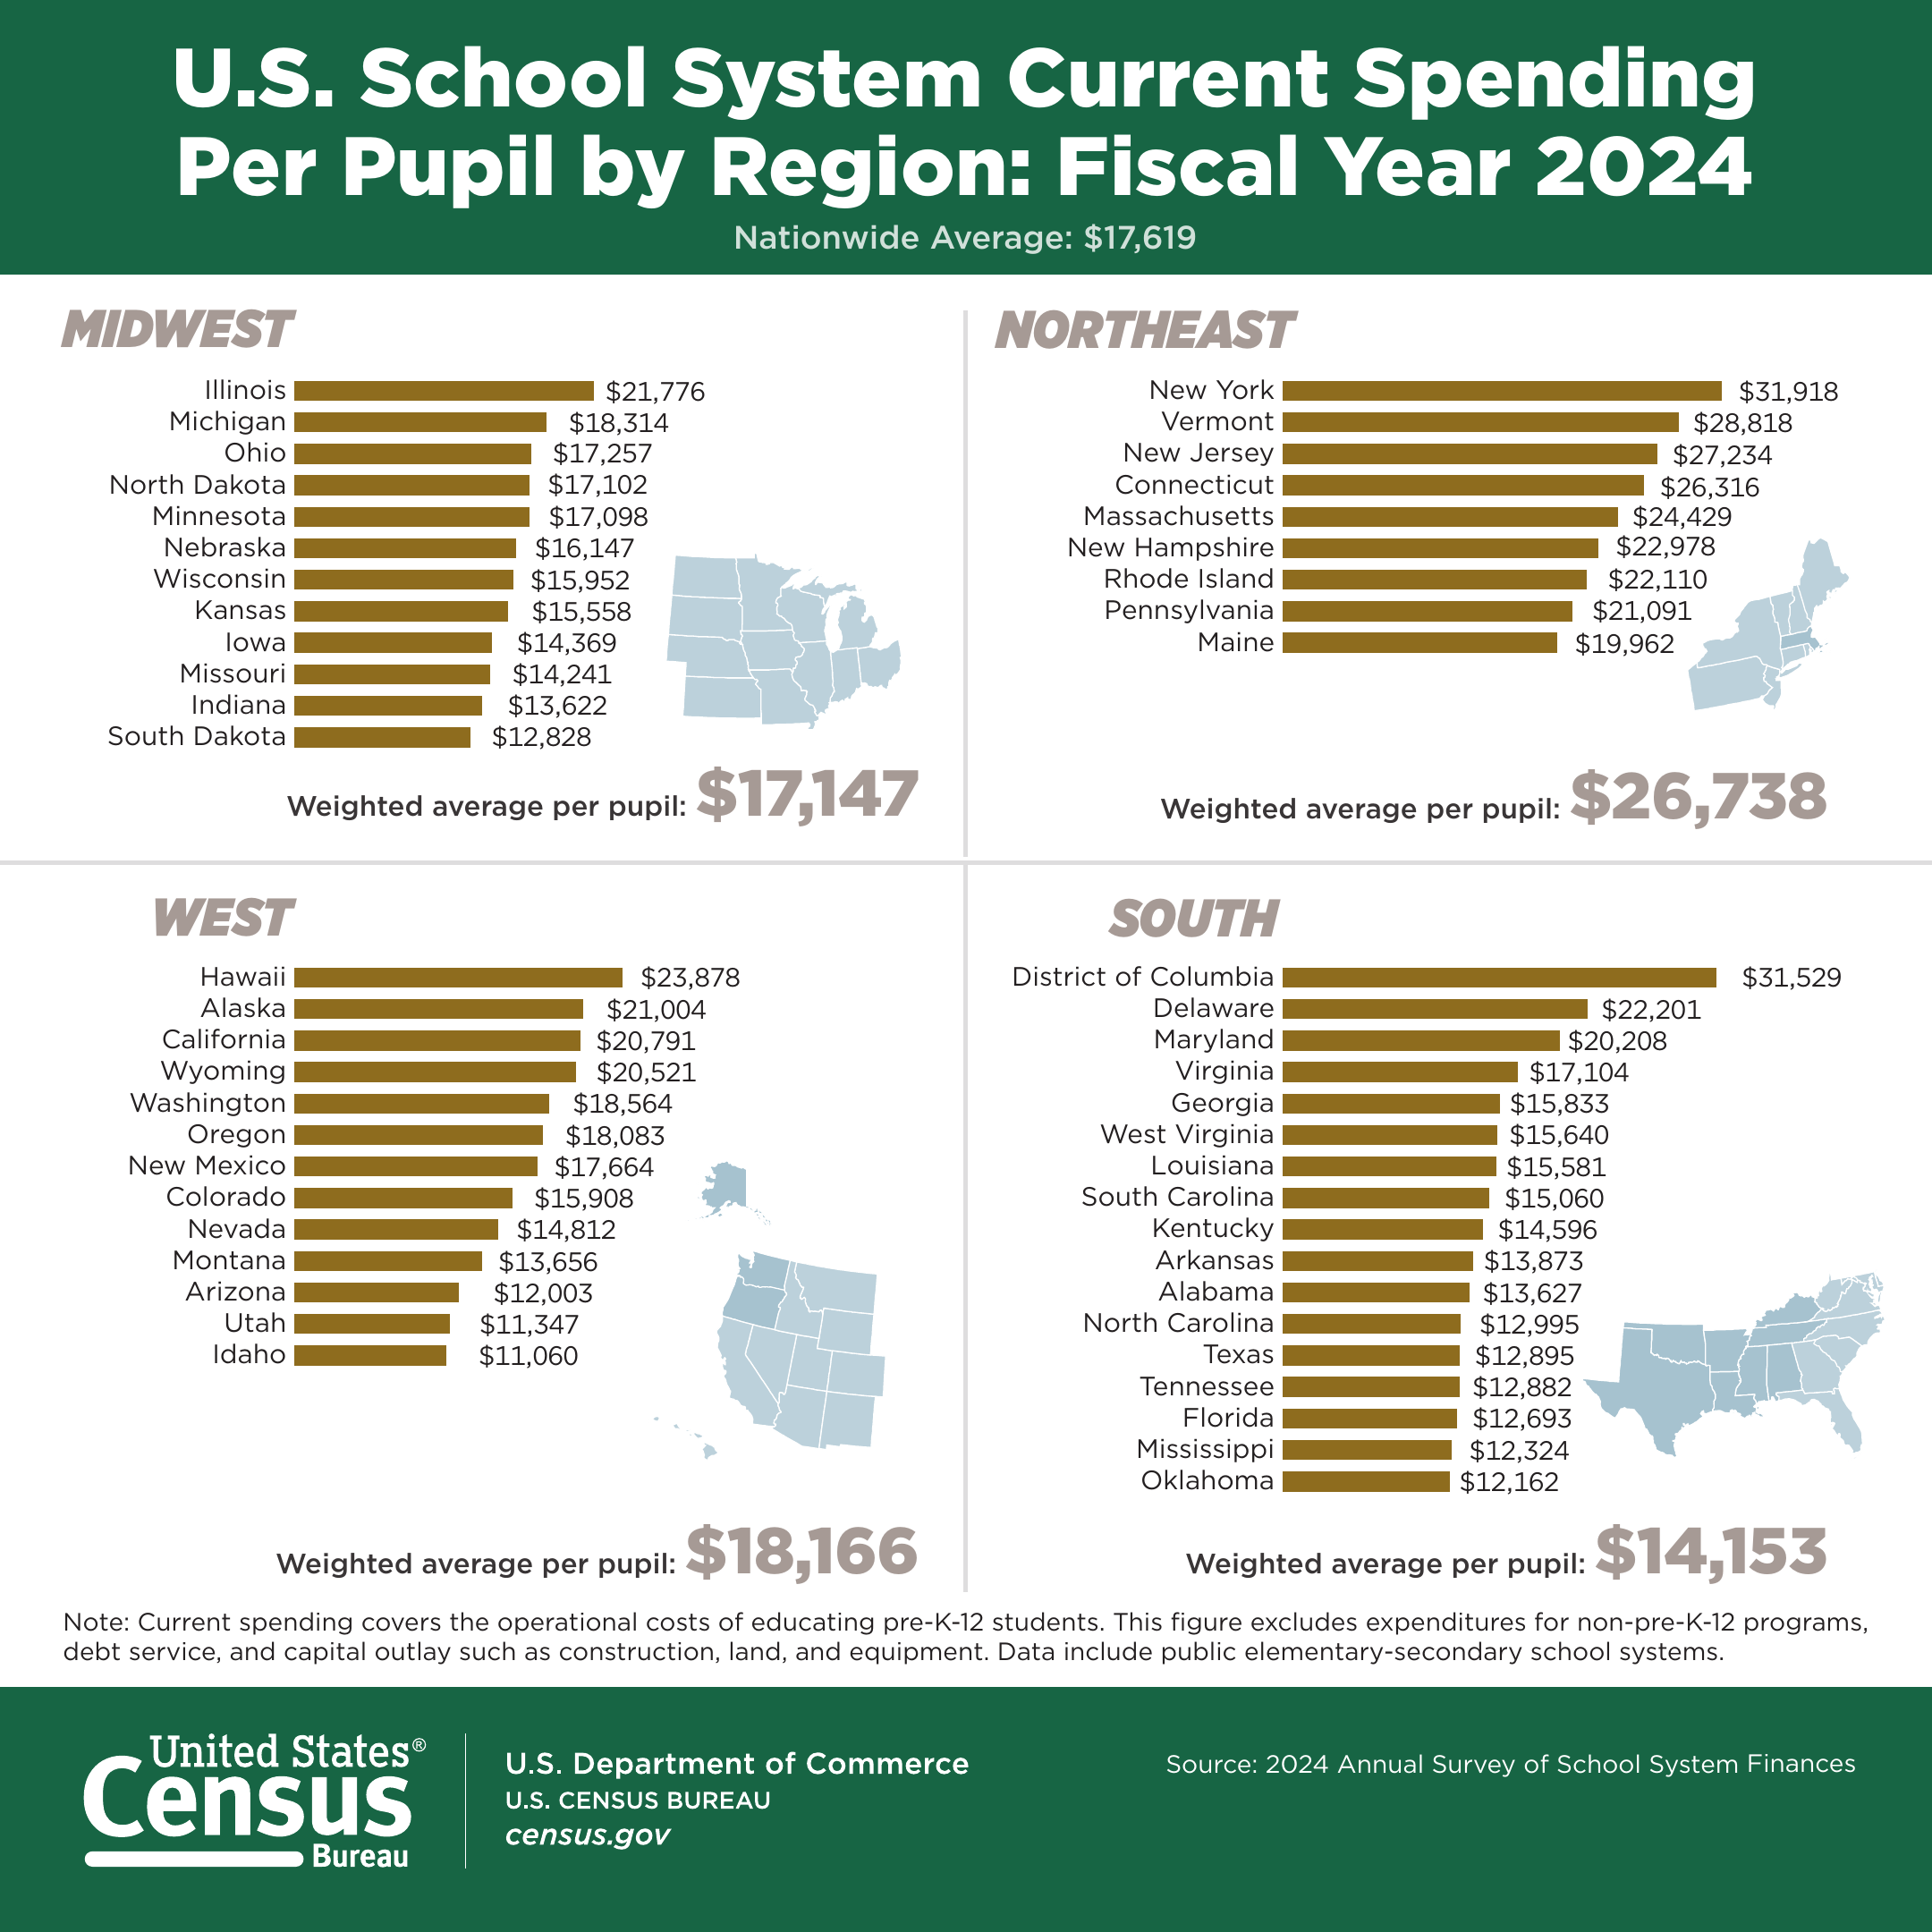
US public schools spent an average of $17,619 per pupil in fiscal year 2024, up 6.6% on the year before, according to the Census Bureau’s Annual Survey of School System Finances. New York spent the most at $31,918 per pupil and Idaho the least at $11,060, so a child in a New York public school had almost three times as much spent on their schooling as a child in Idaho.
Per pupil spending by state
Per pupil spending ranges from about $11,000 to almost $32,000 depending on the state. The figures below are current spending per pupil for fiscal year 2024, from table 8 of the Census Bureau’s 2024 Public Elementary-Secondary Education Finance Data. They are not adjusted for inflation or for differences in living costs between states.
| Highest spending | Per pupil | Lowest spending | Per pupil |
|---|---|---|---|
| New York | $31,918 | Idaho | $11,060 |
| District of Columbia | $31,529 | Utah | $11,347 |
| Vermont | $28,818 | Arizona | $12,003 |
| New Jersey | $27,234 | Oklahoma | $12,162 |
| Connecticut | $26,316 | Mississippi | $12,324 |
| Massachusetts | $24,429 | Florida | $12,693 |
| Hawaii | $23,878 | South Dakota | $12,828 |
| New Hampshire | $22,978 | Tennessee | $12,882 |
| Delaware | $22,201 | Texas | $12,895 |
| Rhode Island | $22,110 | North Carolina | $12,995 |
Only 20 states and the District of Columbia spent more than the national average of $17,619. The two states with the most pupils sit on opposite sides of it. California spent $20,791 per pupil and Texas $12,895. Florida, third by pupil numbers, spent $12,693.
The infographic by the U.S. Census Bureau above sets every state against its neighbours, and the full state list is in the Census Bureau’s summary tables spreadsheet (table 8 for amounts, table 11 for rankings).
Per pupil spending by region
The Northeast spends far more per pupil than any other part of the country, and the South spends the least. The Census Bureau’s regional breakdown weights each state by its number of pupils, which gives these averages for fiscal year 2024.
| Region | Weighted average per pupil | Highest state | Lowest state |
|---|---|---|---|
| Northeast | $26,738 | New York, $31,918 | Maine, $19,962 |
| West | $18,166 | Hawaii, $23,878 | Idaho, $11,060 |
| Midwest | $17,147 | Illinois, $21,776 | South Dakota, $12,828 |
| South | $14,153 | District of Columbia, $31,529 | Oklahoma, $12,162 |
Every one of the nine Northeast states spent more than the national average, and seven of them were in the top 10, the Census Bureau’s May 2026 release says. The South made up half of the 20 lowest-spending states, with five from the Midwest and five from the West making up the rest. In the South only the District of Columbia, Delaware and Maryland spent more than the national average.
The West has the widest spread. Hawaii, Alaska, California and Wyoming all spent more than $20,000 per pupil, while Arizona, Utah and Idaho, three of the four lowest in the country, spent about $11,000 to $12,000.
How school spending per pupil has changed
Spending per pupil has risen every year since 2019, by about a third in total. The national figure went from $13,187 in fiscal year 2019 to $17,619 in 2024, a rise of 33.6% on table 20 of the Census Bureau’s 2024 summary tables.
| Fiscal year | US spending per pupil | Change on the year before |
|---|---|---|
| 2019 | $13,187 | |
| 2020 | $13,501 | 2.4% |
| 2021 | $14,358 | 6.3% |
| 2022 | $15,630 | 8.9% |
| 2023 | $16,526 | 5.7% |
| 2024 | $17,619 | 6.6% |
Part of that rise is inflation. Consumer prices rose 22.7% between 2019 and 2024 on the annual average of the Bureau of Labor Statistics Consumer Price Index (CPI-U), so in real terms spending per pupil went up by about 9% over the five years, and by about 3.6% between 2023 and 2024 (our sums from the Census and BLS figures). The Census Bureau describes the 2024 figure as a historic high, but it is in dollars of each year, not adjusted for inflation.
Some states moved much faster than others. Nevada’s spending per pupil rose 26.9% in a single year, which the Census Bureau’s state notes put down mainly to a $1 billion increase in funding for the state’s Pupil-Centered Funding Plan. Hawaii rose 19.1%, New Mexico 12.6% and California 10.6%. Spending per pupil fell slightly in Montana (0.8%), the District of Columbia (0.3%) and Kentucky (0.3%).
Where school spending goes
Most of the money goes on teaching, and most of it is pay. Of the $17,619 spent per pupil in 2024, $10,346 (58.7%) went on instruction and $6,582 (37.4%) on support services such as pupil support, school and district administration, buildings and transport, on table 8 of the Census Bureau’s 2024 finance tables. Salaries and wages came to $9,685 per pupil and employee benefits to $4,243, so staff pay and benefits made up about 79% of current spending (our sums).
Pay also accounts for most of the gap between states. New York spent $12,536 per pupil on instructional salaries alone, more than Idaho spent per pupil on everything ($11,060), while Idaho spent $4,289 per pupil on instructional salaries. Staff pay and benefits make up about 77% of the $20,857 per pupil gap between New York and Idaho (our sums from the same table).
Across the whole country, public school systems spent $983.7 billion in fiscal year 2024. Current spending made up $842.3 billion of that, and capital outlay on buildings, land and equipment $113.1 billion, according to the Census Bureau’s release. Instructional salaries were the biggest single item at $291.8 billion. Capital spending, debt service and programmes outside pre-K to 12 are left out of the per pupil figures.
Where school funding comes from
US public schools are paid for mostly by states and local taxpayers, with the federal government providing about 12%. Public school systems took in $994.9 billion in fiscal year 2024, up 5.1%. States provided 45.2% ($450.0 billion), local sources 43.2% ($429.8 billion) and the federal government 11.6% ($115.1 billion), the Census Bureau reports.
Property taxes are the main local source, at 63.3% of local revenue, so what a district can raise depends partly on the value of property in its area.
Federal money fell 4.4% in 2024, from $120.3 billion to $115.1 billion. It matters most in poorer and more rural states. Federal sources made up 22.7% of school revenue in Mississippi, 21.0% in Alaska, 19.7% in New Mexico, 19.4% in South Dakota and 19.2% in Louisiana, against 6.3% in New Jersey, 7.9% in Utah and 8.1% in Minnesota and Connecticut.
Which school districts spend the most per pupil
Among the 100 largest school districts, New York City spends the most, at $35,796 per pupil in fiscal year 2024. The Census Bureau’s release lists the top five as follows.
- New York City School District, New York, $35,796
- District of Columbia Public Schools, $31,529
- Atlanta School District, Georgia, $26,117
- Los Angeles Unified, California, $25,631
- San Francisco Unified, California, $25,173
Big districts don’t always spend more. Miami-Dade County, the third largest district with 335,500 pupils, spent $13,931 per pupil, and Clark County in Nevada (Las Vegas) spent $14,774, both below the national average, on table 18 of the Census Bureau’s summary tables.
Questions about per pupil spending
How much does each state spend on education per student?
Between $11,060 and $31,918 per pupil in fiscal year 2024, with a national average of $17,619. New York, the District of Columbia, Vermont, New Jersey and Connecticut spent the most, and Idaho, Utah, Arizona, Oklahoma and Mississippi the least, according to the Census Bureau.
Which state spends the most on education per student?
New York, at $31,918 per pupil in fiscal year 2024. The District of Columbia is close behind at $31,529 but isn’t a state, so Vermont ($28,818) is the second highest state.
Which state spends the least per student?
Idaho, at $11,060 per pupil in fiscal year 2024, followed by Utah at $11,347 and Arizona at $12,003.
How much does the US spend per student in public schools?
$17,619 per pupil in fiscal year 2024, which covers the day-to-day running costs of pre-K to 12 schooling. Total spending including buildings and other costs was $983.7 billion for about 46.4 million pupils.
How much does California spend per pupil?
California spent $20,791 per pupil in fiscal year 2024, 10.6% more than the year before and above the national average of $17,619. It ranked 14th among the states and the District of Columbia.
Does per pupil spending include teacher salaries?
Yes. Current spending per pupil includes all staff salaries and benefits, which make up about 79% of it, as well as supplies, services and transport. It leaves out capital spending on buildings and equipment, debt interest, and programmes outside pre-K to 12 such as adult education.
Why are the Census figures different from other per pupil numbers?
Different sources count different things. The Census Bureau counts current spending by public school systems and divides it by fall enrollment from the National Center for Education Statistics, leaving out charter schools held by nongovernmental bodies. Other figures may include capital costs, use a different year or adjust for inflation and living costs, so always check what a number covers before you compare it.
Sources
- U.S. Census Bureau, U.S. School System Current Spending Per Pupil by Region, Fiscal Year 2024 (infographic, 7 May 2026)
- U.S. Census Bureau, Public School Spending Per Pupil Reaches Historic High in 2024 (release CB26-TPS.29, 7 May 2026, updated 12 May 2026)
- U.S. Census Bureau, 2024 Public Elementary-Secondary Education Finance Data, summary tables 1, 5, 8, 18, 19 and 20 and Appendix B state notes
- U.S. Bureau of Labor Statistics, Consumer Price Index for All Urban Consumers (CPI-U, US city average, annual averages 2019 to 2024)