Food and Drink
Food Waste Statistics in the EU
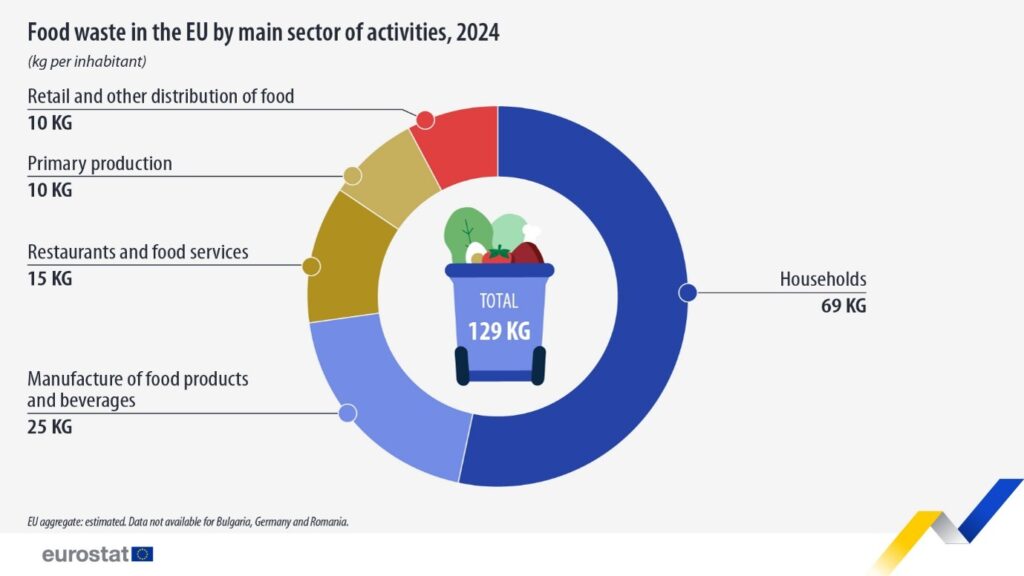
Eurostat's latest figures, for 2024, show that households cause more than half of it (69 kg each), with the rest spread across food factories, restaurants,…
489 reviewed infographics. Search them, or narrow the list by topic or type and sort it the way you want.
Eurostat's latest figures, for 2024, show that households cause more than half of it (69 kg each), with the rest spread across food factories, restaurants,…
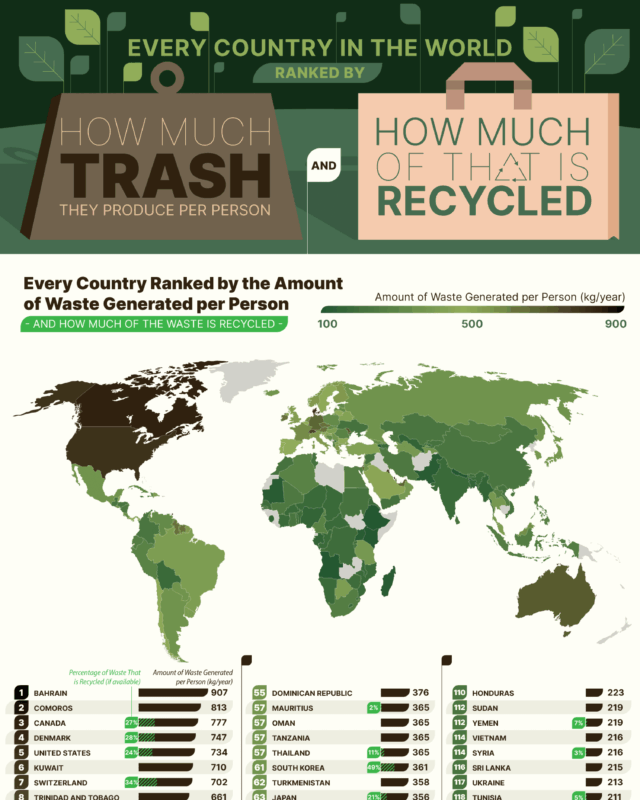
Germany recycles the most of its household and municipal waste of any country with comparable official data: 69% in 2024, according to Eurostat, ahead of…
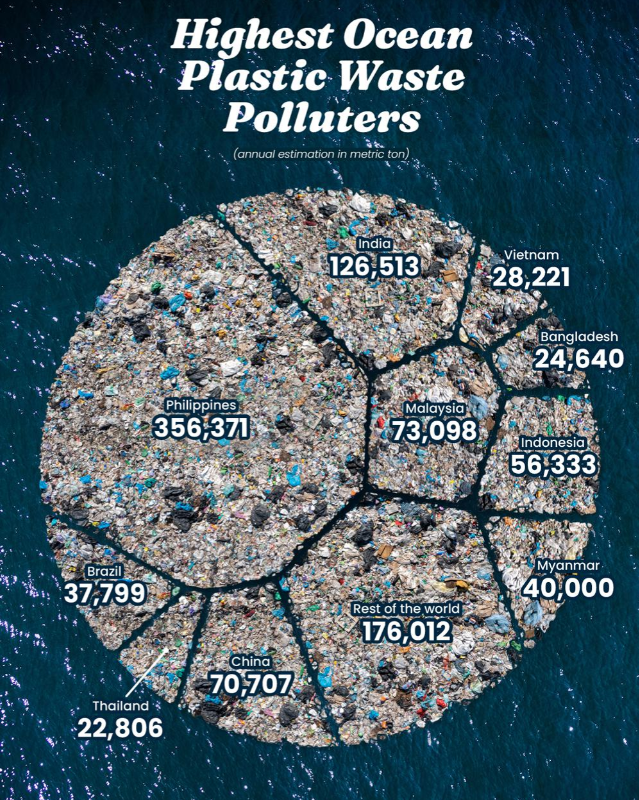
The Philippines alone sends an estimated 356,371 metric tons of plastic into the sea each year, about 35% of the global total.
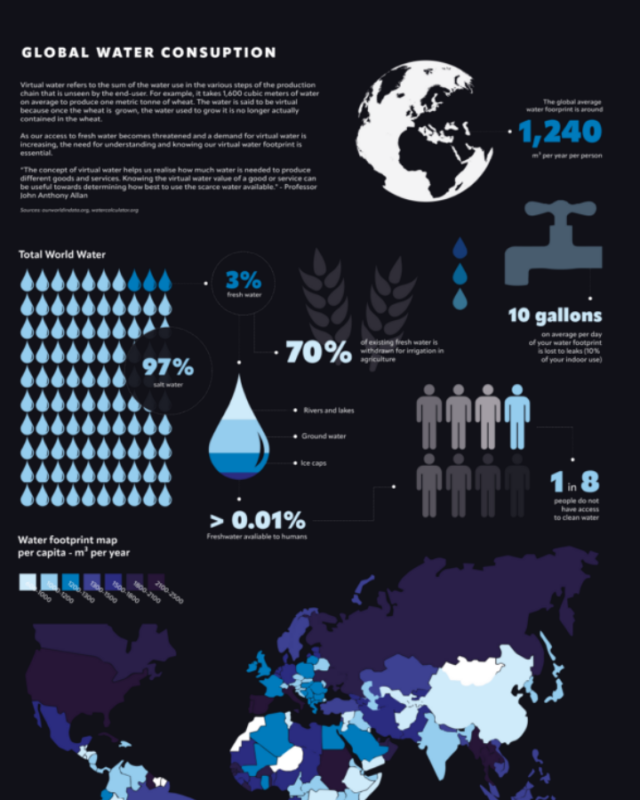
People withdraw about 4,000 cubic kilometres of fresh water a year, and agriculture takes around 70% of it, industry just under 20% and homes about 12%.
Every topic page starts with a short guide to the subject.