Which countries are the highest ocean plastic waste polluters?
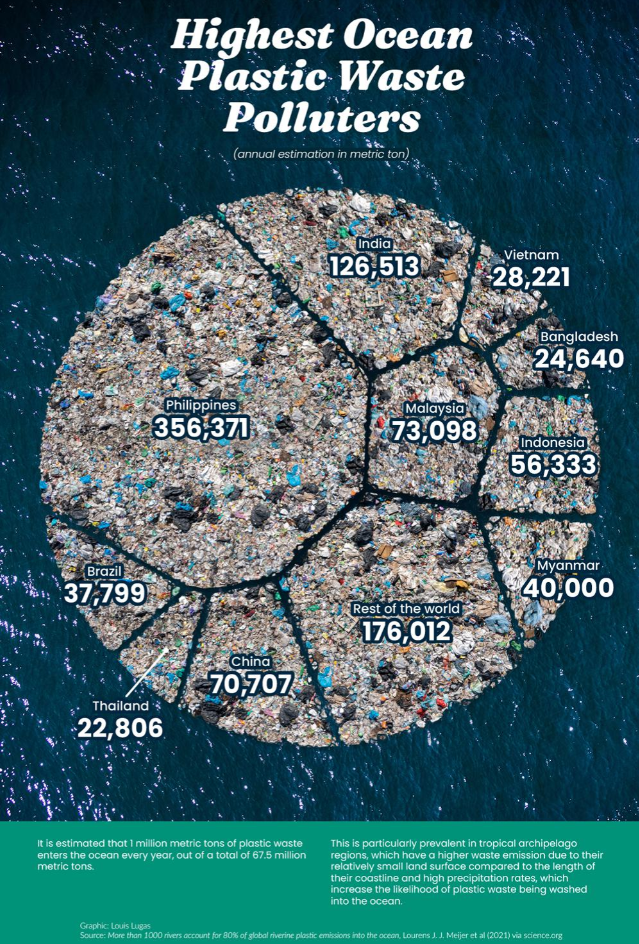
The highest ocean plastic waste polluters are the Philippines, India, Malaysia, China and Indonesia, according to the most detailed river model so far. The Philippines alone sends an estimated 356,371 metric tons of plastic into the sea each year, about 35% of the global total. Nine of the ten biggest sources are in Asia, and Brazil is the only one elsewhere.
The figures come from a 2021 study in Science Advances by Lourens Meijer and colleagues at The Ocean Cleanup, which modelled how much plastic each of the world’s rivers carries to the ocean [1]. The infographic by Louis Lugas Wicaksono, published by Visual Capitalist, uses the study’s country estimates [2]. They are model estimates for 2015, not measurements, so treat them as a guide to scale rather than exact amounts [3].
The top 10 ocean plastic polluting countries
These are the study’s estimates of plastic carried from land to the ocean by rivers each year. The share column is our arithmetic, out of the total of about 1,012,500 tons that the country figures add up to [1][2].
| Rank | Country | Plastic reaching the ocean (metric tons a year) | Share of world total |
|---|---|---|---|
| 1 | Philippines | 356,371 | 35.2% |
| 2 | India | 126,513 | 12.5% |
| 3 | Malaysia | 73,098 | 7.2% |
| 4 | China | 70,707 | 7.0% |
| 5 | Indonesia | 56,333 | 5.6% |
| 6 | Myanmar | 40,000 | 4.0% |
| 7 | Brazil | 37,799 | 3.7% |
| 8 | Vietnam | 28,221 | 2.8% |
| 9 | Bangladesh | 24,640 | 2.4% |
| 10 | Thailand | 22,806 | 2.3% |
| Rest of the world | 176,012 | 17.4% |
Together the top ten account for about 83% of the estimated total. By region, Asia accounts for 81% of plastic reaching the ocean, Africa 8%, South America 5.5%, North America 4.5%, and Europe and Oceania together less than 1% [3].
Why the Philippines and Malaysia rank so high
The ranking does not follow how much plastic a country uses. It depends on three things. How much plastic waste a country produces, how much of it is badly managed (dumped, left in open landfills or littered), and how likely that mismanaged waste is to get into a river and then the sea [3].
The last step is what puts small coastal countries at the top. China produces about 12.8 million tons of mismanaged plastic waste a year and Malaysia about 0.8 million, yet the model estimates that 9.0% of Malaysia’s reaches the ocean against 0.6% of China’s [1]. For the Philippines the figure is 8.8% [1]. The study found that countries with a small land area compared with the length of their coastline, and with high rainfall, are the most likely to emit ocean plastic. It names tropical archipelagos such as the Philippines and Indonesia as examples [1].
The Philippines has more than 7,000 islands and most people live near the coast [2][3]. Cities like Manila are drained by relatively small rivers close to the coast, which carry plastic quickly to the sea [3]. Seven of the world’s ten most polluting rivers are in the Philippines, and the Pasig River in Manila alone accounts for about 6.4% of all river plastic reaching the ocean [3].
It’s thousands of rivers, not a handful
Earlier studies suggested that a few big rivers, such as the Yangtze and the Ganges, carried most of the world’s ocean plastic. One estimated that the top ten rivers were responsible for more than 90% [3]. The Meijer study used much more detailed data on rainfall, wind, terrain, land use and how far waste is from rivers and the coast, and came to a very different answer [1].
It found that 1,656 rivers carry 80% of the plastic reaching the ocean, and that the top ten rivers account for only about 18% [3]. That gives the study its title, and it matters for clean-up. Fixing a handful of big rivers would not solve the problem. Waste collection has to improve across thousands of smaller river basins [3].
The study’s own example makes the point. The Ciliwung River basin in Java is 275 times smaller than the Rhine basin and produces 75% less plastic waste, yet it sends around 100 times as much plastic to the sea, about 200 to 300 tons a year against 3 to 5 tons [3].
What about the US and other rich countries?
Rich countries produce far more plastic waste per person but send very little straight into the sea, because nearly all of it is collected and landfilled, burned or recycled. European countries emit less than 0.1 kg of ocean plastic per person a year, against 3.5 kg in the Philippines [3].
That does not mean rich countries play no part. A 2020 study found that the United States generated more plastic waste than any other country in 2016, 42 million metric tons [4]. Between 0.15 and 0.99 million tons of US plastic collected for recycling was shipped to countries where it was not properly managed, and another 0.14 to 0.41 million tons was illegally dumped in the US [4]. Counting those, the authors put the US contribution to plastic in coastal environments among the highest in the world [4]. Plastic sent abroad for recycling isn’t counted under the exporting country in river models like the one above.
How much plastic enters the ocean each year?
Estimates vary a lot depending on what is counted. The Meijer study’s central figure is about 1 million metric tons a year from rivers, within a range of 0.8 million to 2.7 million tons. That is about 1.5% of the 67.5 million tons of mismanaged plastic waste generated worldwide [1]. The infographic’s footer gives the 67.5 million figure as total plastic waste, but it is the mismanaged waste only.
The OECD’s Global Plastics Outlook takes a wider view. It found that 6.1 million tons of plastic waste leaked into rivers, lakes and the ocean in 2019, and that about 30 million tons has already built up in the ocean and 109 million tons in rivers [5]. Because so much is sitting in rivers, plastic will keep reaching the sea for decades even if waste management improves [5].
River figures also leave out plastic lost at sea. Research summarised by Our World in Data puts 70% to 80% of ocean plastic by weight comes from land, and 20% to 30% from fishing nets, lines, ropes and abandoned boats [3].
Questions about ocean plastic polluters
Which country is the largest ocean plastic polluter?
The Philippines, with an estimated 356,371 metric tons a year carried to the sea by more than 4,800 rivers, about 35% of the world total [1].
Which 10 countries pollute the ocean the most?
The Philippines, India, Malaysia, China, Indonesia, Myanmar, Brazil, Vietnam, Bangladesh and Thailand, in that order, according to the Meijer study [1].
Who are the biggest contributors to plastic waste?
That is a different question from ocean plastic. The United States produced the most plastic waste of any country in 2016, 42 million tons or about 130 kg per person, followed by India and China. The EU countries together produced more than either India or China [4].
What is the Great Pacific Garbage Patch?
It is a large area of the North Pacific where floating plastic collects, carried there by circling ocean currents. Fishing nets, lines and ropes are estimated to make up 52% of the plastic by weight in the patch, which is much higher than in ocean plastic generally [3].
How does plastic end up in the ocean?
Most of it is plastic waste that isn’t collected or is dumped or left in open landfills. Rain and wind wash it into drains and rivers, and rivers carry it to the sea. The risk is highest near cities on the coast with heavy rainfall and poor waste collection [3].
Sources
- Meijer, L. J. J. et al., More than 1000 rivers account for 80% of global riverine plastic emissions into the ocean, Science Advances 7(18), 2021 (full text via Europe PMC).
- Visual Capitalist, Which Countries Pollute the Most Ocean Plastic Waste?, 17 February 2023, graphic by Louis Lugas Wicaksono. The original post for the infographic.
- Hannah Ritchie, Our World in Data, Where does the plastic in our oceans come from?, 2021.
- Law, K. L. et al., The United States’ contribution of plastic waste to land and ocean, Science Advances 6(44), 2020.
- OECD, Global Plastics Outlook, Economic Drivers, Environmental Impacts and Policy Options, February 2022.
Last reviewed 10 November 2026