

Environment and Energy
US Hurricane History Map, Every Landfall From 1851 to 2024
Landfalls crowd the Texas, Louisiana and Florida coasts, and the only Category 5 landfalls are the 1935 Labor Day hurricane, Camille, Andrew and Michael.
476 reviewed infographics. Search them, or narrow the list by topic and sort it the way you want.
Landfalls crowd the Texas, Louisiana and Florida coasts, and the only Category 5 landfalls are the 1935 Labor Day hurricane, Camille, Andrew and Michael.
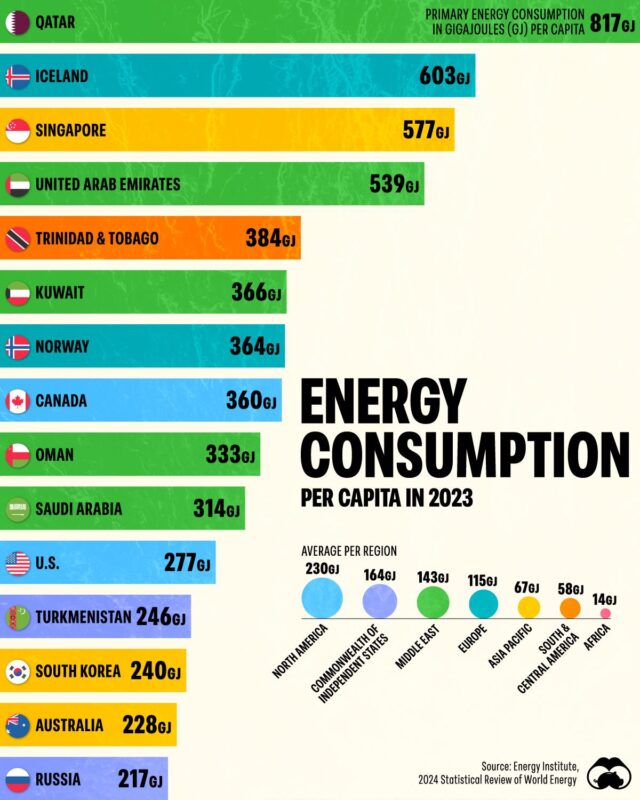
This Visual Capitalist chart ranks the top 15 countries and compares regions, from North America at 230 GJ per person to Africa at 14 GJ, using Energy…
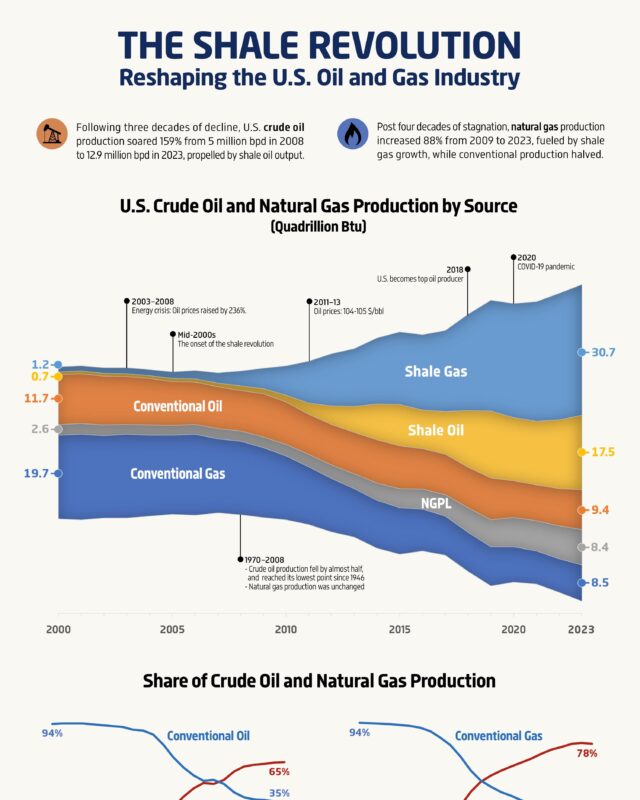
Crude oil output rose 159% from 5 million barrels a day in 2008 to 12.9 million in 2023, and natural gas output rose 88% from 2009.

The United States led at 12,927 thousand barrels per day, and Texas alone, at 5,512, out-produced every country except Russia and Saudi Arabia.

The world produced 82,757 thousand barrels per day.

Cows and roses lead with 12 nicknames each, followed by apples with 9.

In the 12 months to November 2024 the US exported 4.17 million barrels a day and imported 6.58 million, a deficit of 2.40 million.

Imports grew from about 1.4 million to 11.1 million barrels a day, and Russia became the largest supplier at 2.19 million barrels a day, ahead of Saudi…

Taxes and levies made up 11.7 cents of that.

China bought 4,057 million barrels of crude that year, about 11.1 million barrels a day.
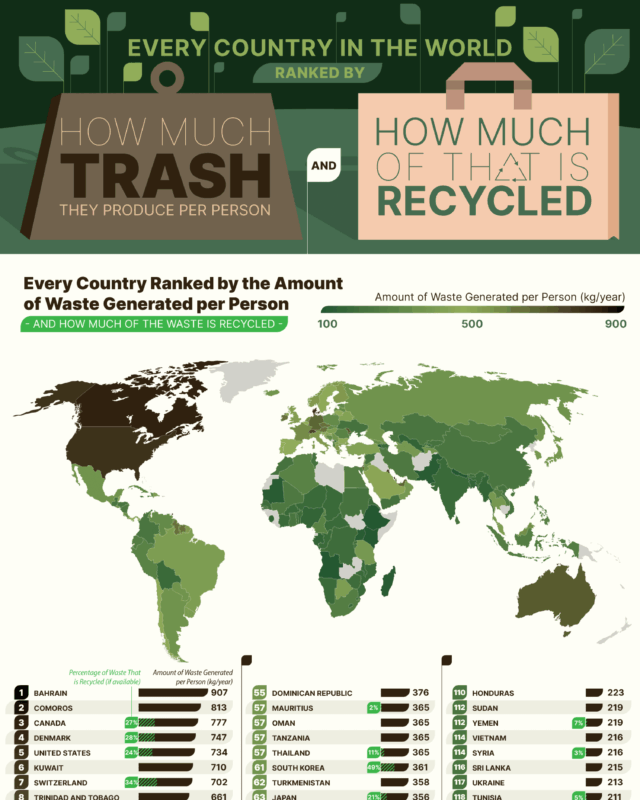
Singapore is a close second and recycles the highest share, 59%.

The map shades every country by its own record and labels the hottest reading on each continent, from 55C in Tunisia to 20.7C in Antarctica.
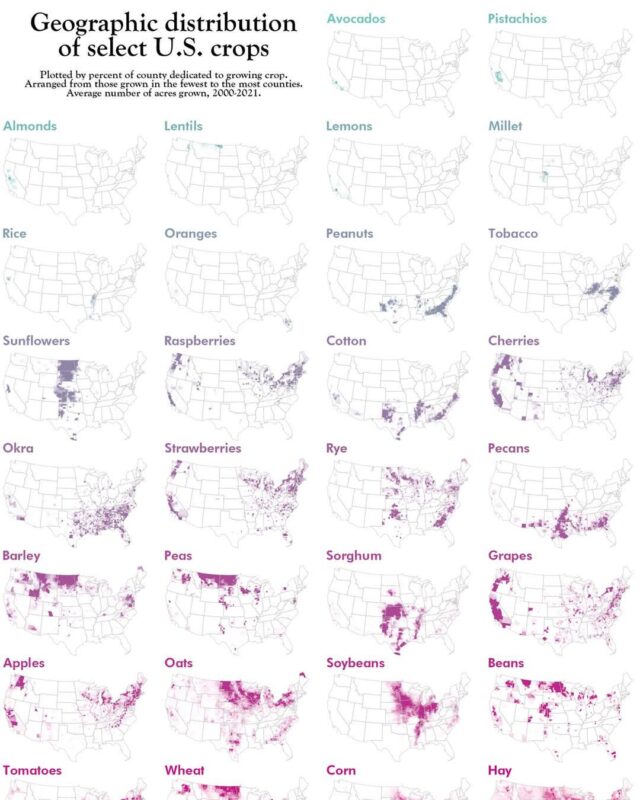
These maps by Erin Davis show the geographic distribution of select US crops, shading every county by the share of its land used for each of 30 crops,…

China leads at about 12 billion tonnes in 2023, ahead of the USA at 4.9 billion and India at 3.1 billion.

This chart by The Etymology Nerd, the linguist Adam Aleksic, explains where 24 flower names come from, from begonia to violet.
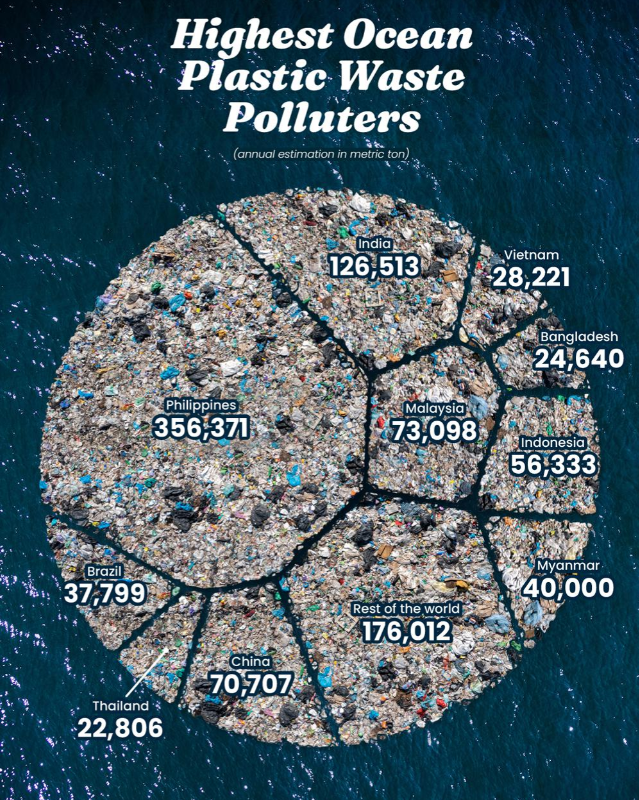
Nine of the top ten are in Asia, and together the ten account for about 83% of the roughly 1 million tons of river plastic estimated to reach the sea each year.

This map by cartographer Perrin Remonté shows world rainfall patterns by two measures at once: how much rain falls in a year and how seasonal it is.

It charts each province's 2022 coal power and renewable outlook to 2050, and shows that no province has both the large land area needed for renewables and…
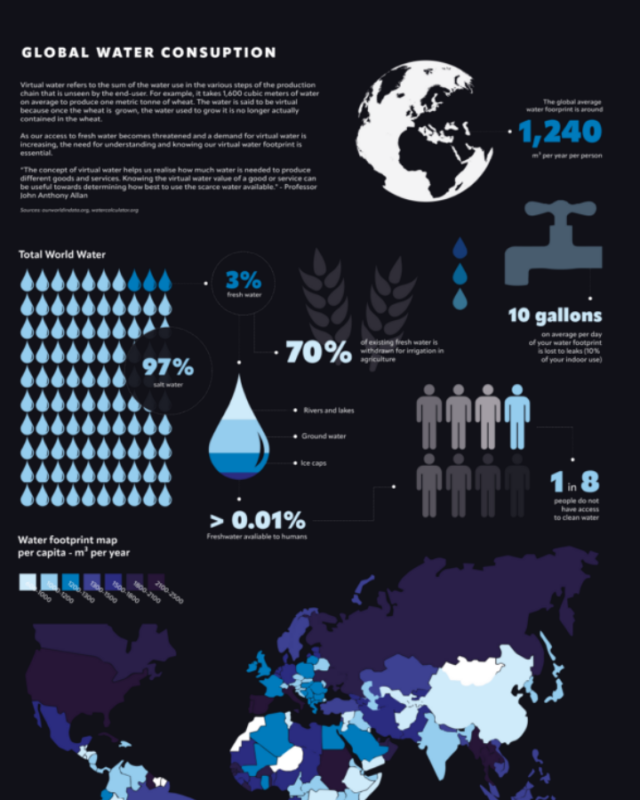
It gives an average footprint of about 1,240 cubic metres per person a year, says 70% of fresh water goes to farming, and maps water footprints by country.

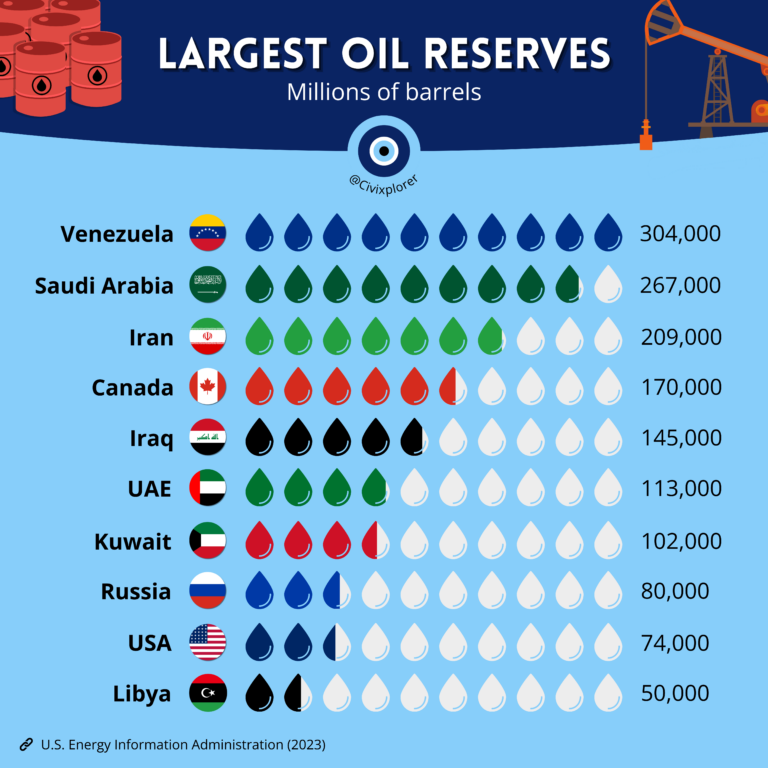
Energy Information Administration figures for 2023.

Monitored wildlife populations in Latin America and the Caribbean fell by an average of 95% between 1970 and 2020, more than any other region, against 73%…

Farmland rose from 12.9 to 66.6 million hectares, mostly cattle pasture, while forest shrank from 380 to 327 million hectares, a 14% net loss of native…

Richer countries use more electricity (R² 0.8), and the high income, low electricity corner is empty.
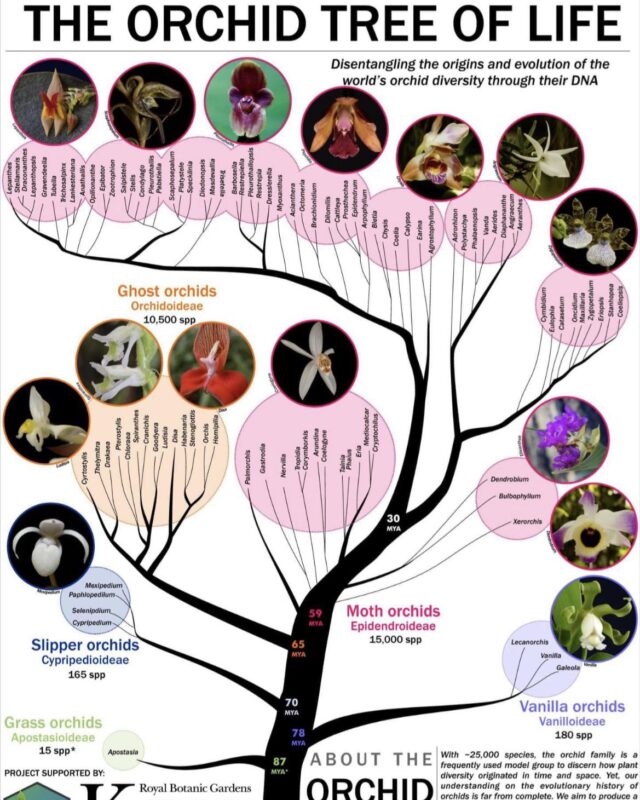
The Orchid Tree of Life poster shows how the five orchid subfamilies branched off over the last 87 million years, from the grass orchids to Epidendroideae,…
Every topic page starts with a short guide to the subject.
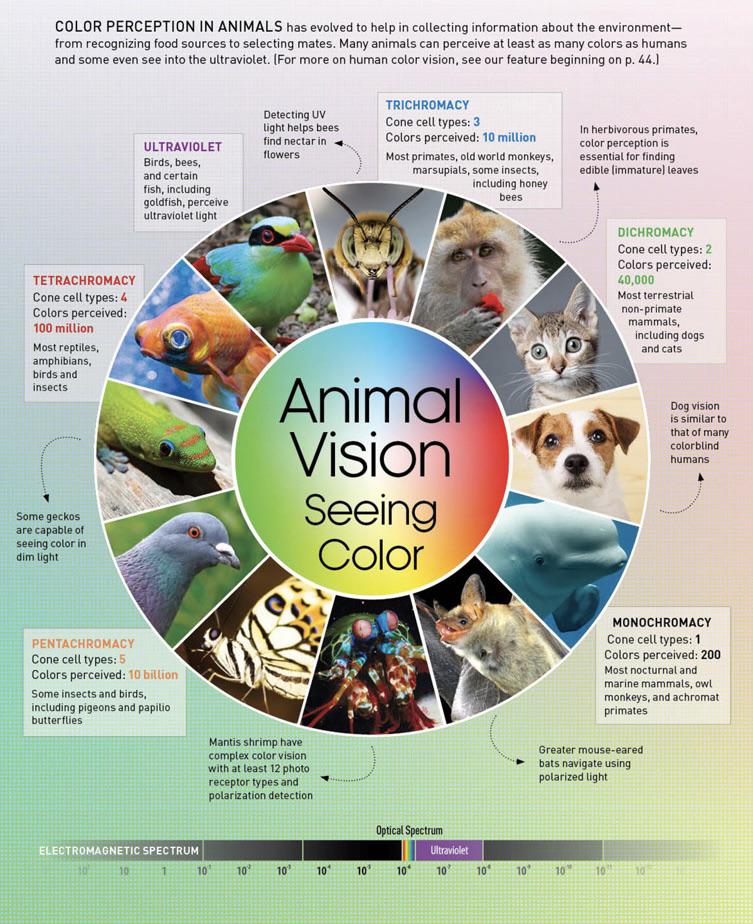








Give it a permanent page where people looking for your subject find it, with your name and a link to your site. Content marketers, agencies, designers and researchers all list here.