

Food and Drink
Types of Bananas, 12 Dessert and Cooking Varieties
There are hundreds of types of bananas, split into sweet dessert bananas eaten raw and starchy cooking bananas such as plantains.
These infographics are guides to what we eat and drink, including types of fruit, cheese and vegetables, chilli heat, food prices and food trade, with sections for drinks and for world cuisine. Each page credits the creator, writes out every item on the graphic and checks claims against reliable food and nutrition sources. Favourites include 16 types of melon, the Scoville scale of 166 peppers, a types of cheese chart, how to make coffee 38 ways and spice blends from around the world.
There are hundreds of types of bananas, split into sweet dessert bananas eaten raw and starchy cooking bananas such as plantains.
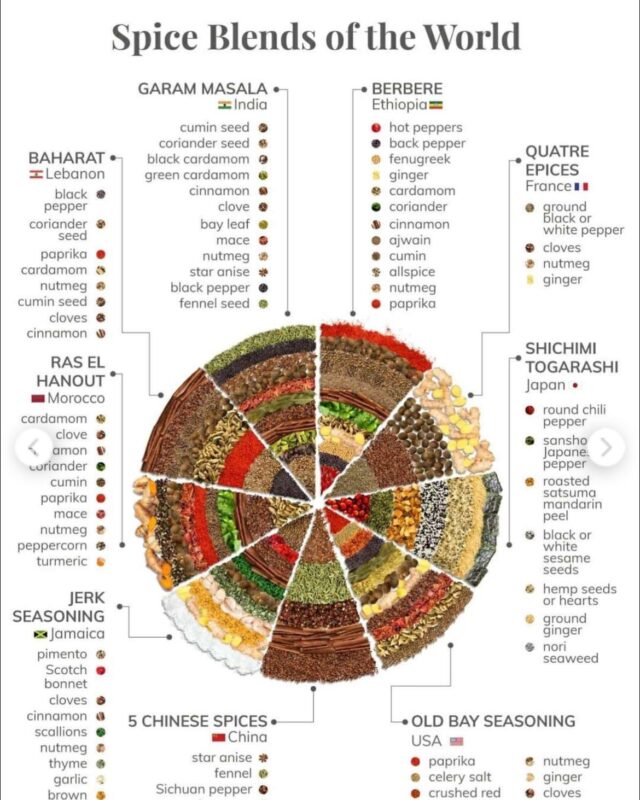
Spice blends from around the world include garam masala from India, berbere from Ethiopia, baharat from the Middle East, quatre épices from France, ras el…

A wine varietal is a wine made mainly from one grape variety and named after it, such as Merlot or Sauvignon Blanc.

In one test of 14 US brands, gas filled 43% of the average bag, from 19% for Fritos to 59% for Cheetos.
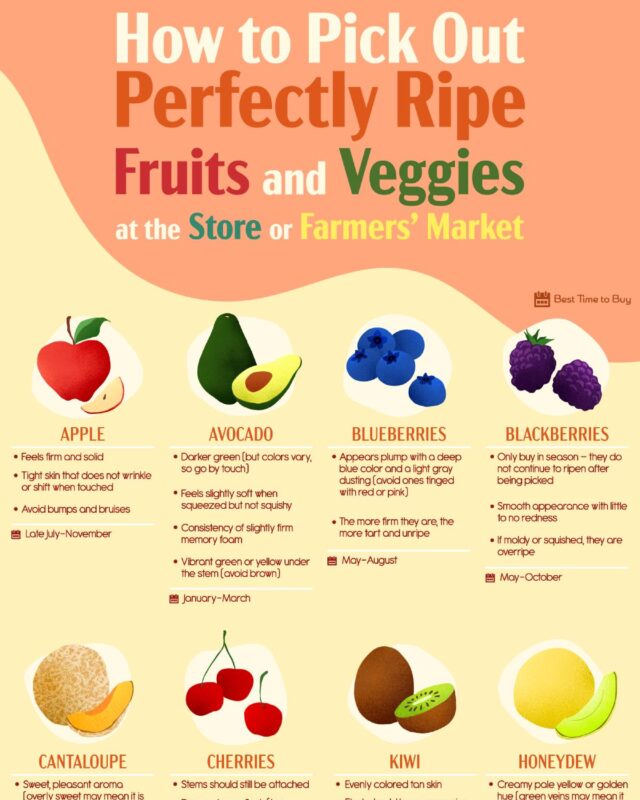
To pick ripe fruit, smell the stem end, press gently and feel the weight: ripe fruit is fragrant, gives slightly and feels heavy for its size.

Bell peppers score 0, jalapeños 2,500 to 8,000, habaneros 100,000 to 350,000 and the Carolina Reaper up to about 2.2 million.
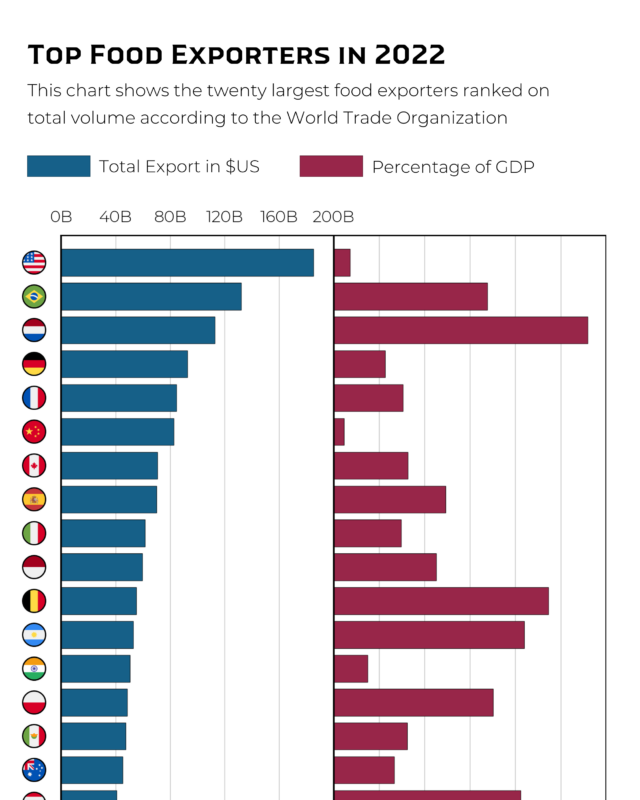
Relative to the size of its economy, the Netherlands depends on food exports most, at about 11% of GDP.

Most states close bars at 2:00 a.m.: 30 states and Washington, DC, on VinePair's 2022 map.
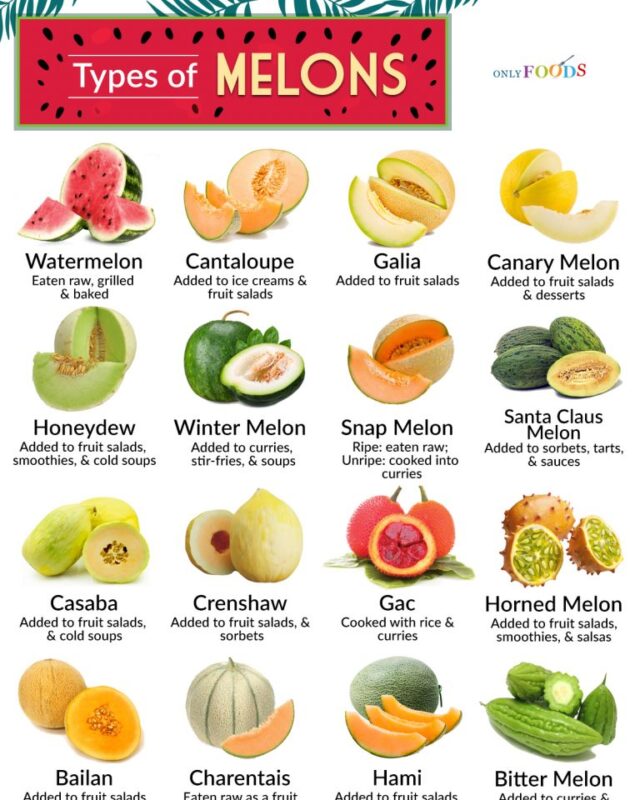
Types of melon fall into three groups: true melons, which are all one species (Cucumis melo) and include cantaloupe, honeydew, galia and Charentais;…
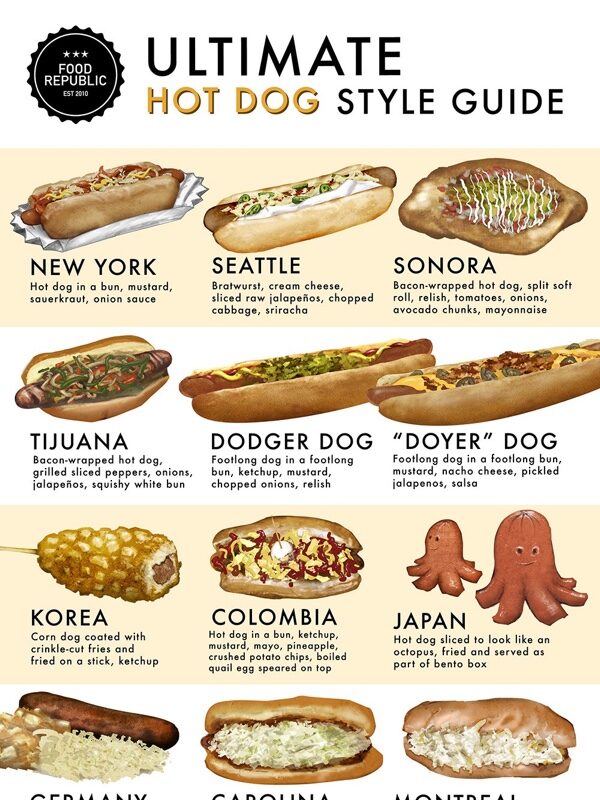
Hot dog styles vary by what goes on top.

The 10 most popular Thai dishes on this guide by Siamais, a Thai restaurant in Birmingham, are pad thai, tom yum goong, yellow, red and green curry, khao…
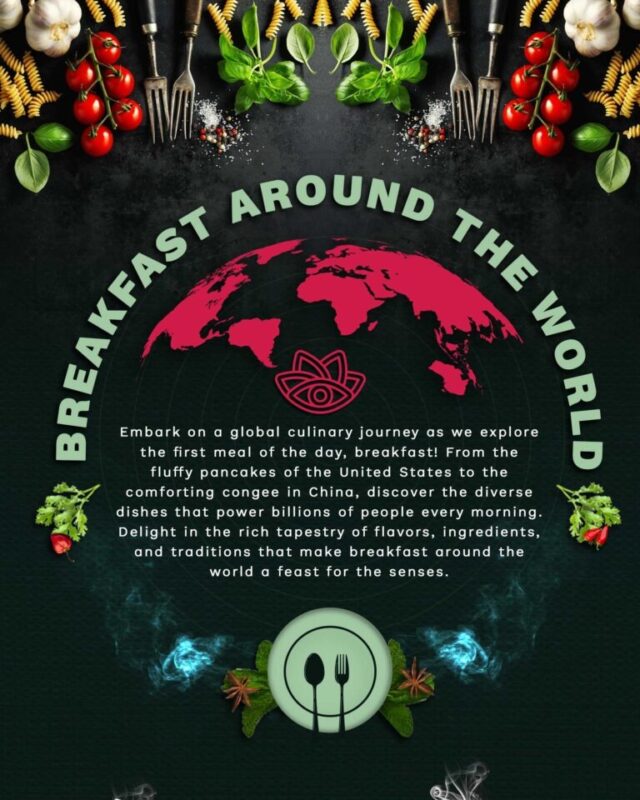
This breakfast around the world infographic by Lulu Wild shows ten traditional morning meals from ten countries.
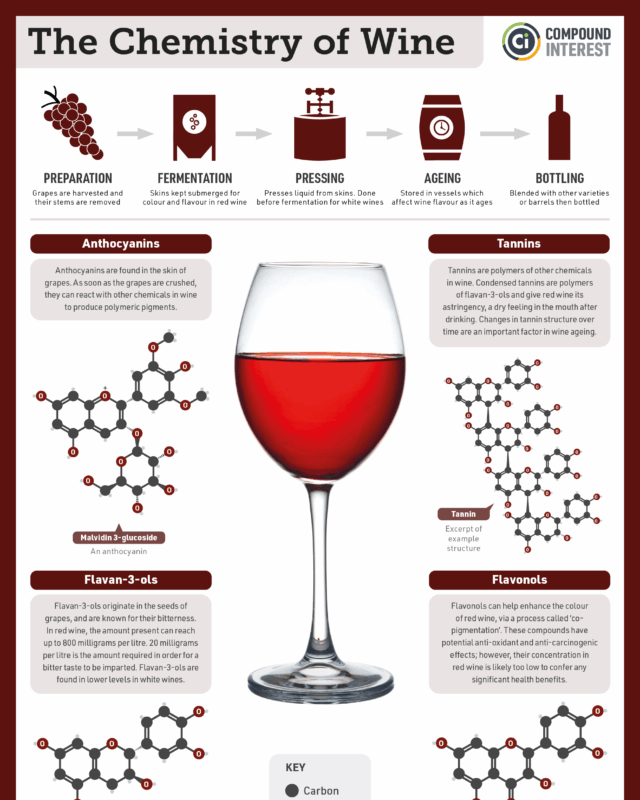
The 29 infographics here fall into a few groups. There are guides to types of food, such as melons, bananas, cheese, vegetables and spice blends, and heat charts for chilli peppers. There are trade and price charts on food exports, food imports and the cost of protein and calories, plus maps of where US crops are grown. The rest cover dishes and drinks, from hot dog styles and European Christmas desserts to coffee recipes, wine chemistry and US bar closing times.
For chilli heat, the Scoville Scale of 166 Peppers, From Bell Pepper to Pepper X by u/Life_Ad_2142 on Reddit sorts peppers into ten heat tiers, with Apollo the hottest pepper at 3,000,000 and pure capsaicin at 15 to 16 million SHU. The shorter TasteAtlas chart, Habanero Scoville Rating and 34 More Peppers, by TasteAtlas, rates the habanero at 100,000 to 350,000 and puts Pepper X at the top with 3,180,000.
Two charts rank food exporters using WTO data. Top Food Exporters in 2022, the 20 Largest Countries by World Charts (u/oscarleo0) shows the United States leading with about $185 billion, while the Econovis map Largest Food Exporter in the World, Food Exports Map 2023 puts the United States at US$168 billion in 2023, ahead of Brazil at US$143 billion.
For food costs, Cheapest Protein Sources per Gram, 41 Foods Compared by u/James_Fortis shows dried pinto beans, split peas, lentils and chickpeas costing about $0.50 or less for 30 g of protein, against $5.76 for ribeye steak. Pop Chart Lab's Types of Cheese Chart, 65 Cheeses by Milk and Texture sorts 65 cheeses by milk and then texture, with cow's milk accounting for 43 of them.
The collection also has two sections of its own, Drinks and World Cuisine.
Only Foods also supplies the 16 types of melon chart, with photographs and usual uses. Its text version separates true melons from the five entries that belong to other groups.
On the Scoville Scale of 166 Peppers by u/Life_Ad_2142, the hottest pepper is Apollo at 3,000,000 SHU, followed by Pepper X at 2,693,000 and Dragon's Breath at 2,480,000. Only pure capsaicin, which is not a pepper, rates higher at 15 to 16 million SHU.
The United States. The Econovis food exports map puts it first in 2023 with US$168 billion, ahead of Brazil at US$143 billion and the Netherlands at US$118 billion.
Dried legumes. On u/James_Fortis's chart of 41 foods priced at Walmart, pinto beans, split peas, lentils and chickpeas all cost about $0.50 or less for 30 g of protein, compared with $5.76 for ribeye steak.
Give it a permanent page where people looking for your subject find it, with your name and a link to your site. Content marketers, agencies, designers and researchers all list here.