

Technology
History of Artificial Intelligence Timeline, 1943 to 2023
The history of artificial intelligence runs from a 1943 model of the brain's neurons and the 1956 Dartmouth workshop that named the field, through two AI…
These infographics are about the past, including timelines of people and inventions, medieval life, heraldry, wars and the generations who lived through them. Each page credits the original artist, writes out the full timeline or guide and corrects dates where the graphic is wrong. Start with nine medieval occupations illustrated, a heraldry guide to shields, tinctures and charges, a timeline of key events by generation, who lived when, famous people since 1200 or facts about the D-Day landing at Omaha Beach. Science and technology timelines, such as the history of life on Earth, are filed in their own hubs and listed here as well.
The history of artificial intelligence runs from a 1943 model of the brain's neurons and the 1956 Dartmouth workshop that named the field, through two AI…

Democrats and Republicans have won every presidential election since 1852, while third parties such as the Bull Moose, Dixiecrat and Reform parties have…
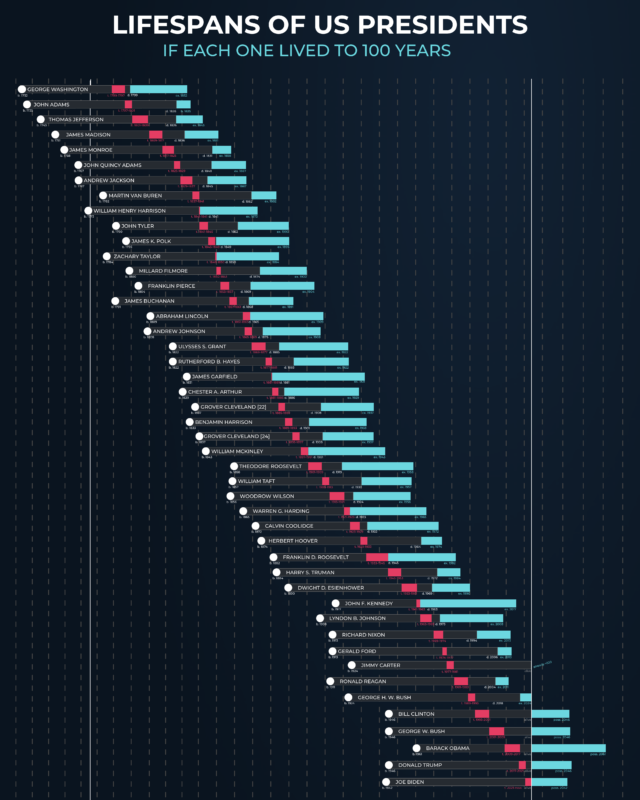
Of the 40 presidents who have died, John F.

Complex cells followed by about 1.85 billion years ago, the first large animals about 580 million years ago, and the Cambrian explosion from 538.8 million…
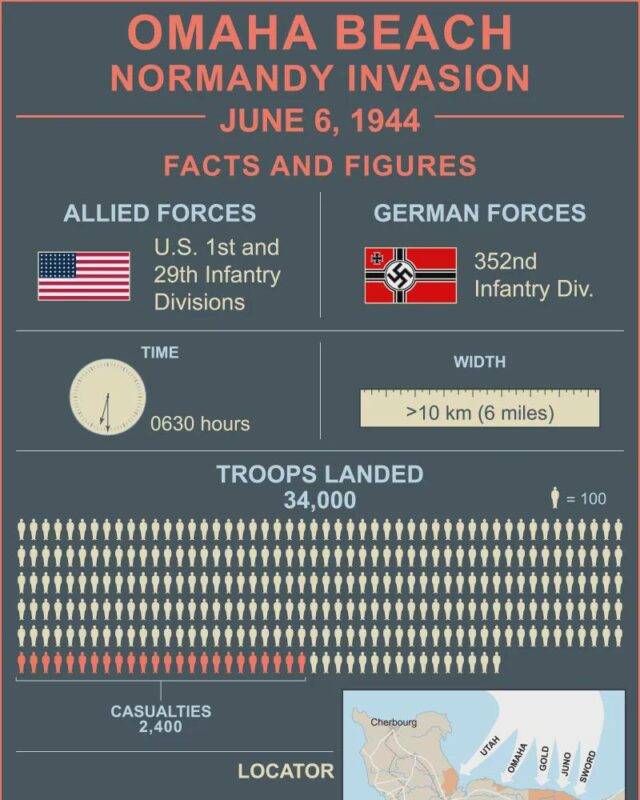
On 6 June 1944 the US 1st and 29th Infantry Divisions landed there from 0630 against the German 352nd Infantry Division.

The three eras of the Phanerozoic eon are the Paleozoic (538.8 to 251.9 million years ago), the Mesozoic (251.9 to 66 million years ago) and the Cenozoic…

The internet's history runs from ARPANET's first connection on 29 October 1969, through the switch to TCP/IP in 1983 and the World Wide Web in 1991, to the…

Most medieval people worked the land as peasants, many of them serfs tied to a lord's manor.

Before it came Kosovo (2008, not a UN member), Montenegro and Serbia (2006) and East Timor (2002).
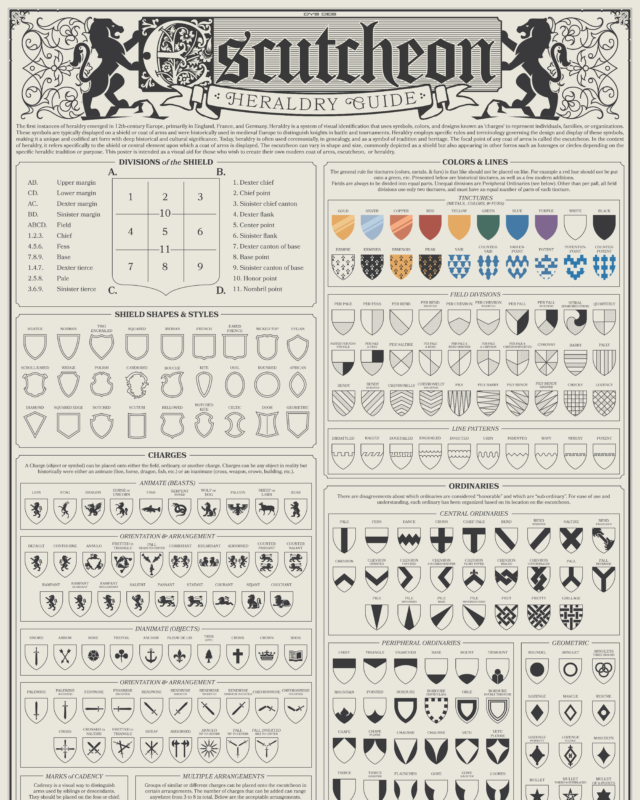
It began in the High Middle Ages, in England in the later 1100s.

Line famous lives up and surprising overlaps appear: Shakespeare and Galileo were both born in 1564, Thomas Jefferson and John Adams died on the same day in…

The ten deadliest wars account for 90% of the total, while most conventional wars killed a few thousand soldiers.
The 27 infographics in this hub fall into a few groups. The first is war, with combatant death tolls, the D-Day landing and the falling number of living World War II veterans. The second is timelines of inventions and technology, covering antibiotics, the sewing machine, the lawn mower, the internet and artificial intelligence. There are also charts of US presidents and political parties, timelines of deep time and human evolution, comparisons of famous buildings, a map of the newest countries since 1990, and guides to medieval jobs and heraldry.
For war, start with Combatant Deaths in Conventional Wars, 1800 to 2011 by Our World in Data. World War II, at 21 million to 30.8 million combatant deaths, is by far the largest circle on it, and World War I follows at 7.1 million to 8.9 million. How Many WW2 Veterans Are Still Alive, US Figures 2015 to 2030 is a chart by Reddit user u/TA-MajestyPalm based on US Department of Veterans Affairs data. It shows living American WW2 veterans falling from 939,322 in 2015 to 66,143 in 2024, with 5,182 projected for 2030. The Britannica graphic Omaha Beach Facts, the D-Day Landing on 6 June 1944 records that about 34,000 US troops landed by the end of the day and that US forces suffered 2,400 casualties.
Two charts compare buildings. RubberBond's How Long Did It Take to Build 32 Famous Structures has the Leaning Tower of Pisa as the longest build at 199 years and the Space Needle as the quickest at 1 year. George F. Cram's Historical Buildings Chart of 1884, 78 High Buildings Compared draws 78 structures to one scale, from the 25 foot Temple on the Ilissus to the 555 foot Washington Monument.
Two more charts cover the lives of US presidents. US Presidents by Age, Lifespans and Years in Office Chart shows that Theodore Roosevelt was the youngest to take office, at 42. In Average Lifespan of US Presidents, and If Each Lived to 100, u/tycooperaow gives the average lifespan of presidents who have died as about 72 years, from John F. Kennedy at 46 to Jimmy Carter at 100.
World War II. The Our World in Data chart of combatant deaths in conventional wars from 1800 to 2011 puts it at 21 million to 30.8 million combatant deaths, with World War I next at 7.1 million to 8.9 million.
A chart by Reddit user u/TA-MajestyPalm, based on US Department of Veterans Affairs data, shows living American WW2 veterans falling from 939,322 in 2015 to 66,143 in 2024. It projects 30,607 in 2026 and 5,182 in 2030.
South Sudan, independent since 9 July 2011, is the youngest of the 31 countries on Julie Peasley's map of countries formed since 1990. It is one of four on the map that followed a war of independence.
Give it a permanent page where people looking for your subject find it, with your name and a link to your site. Content marketers, agencies, designers and researchers all list here.