

Presidents and Elections
Presidential Election Results 1976 to 2020 Including Non-Voters
Not voting was the most common result in 11 of the 12 elections, peaking at 48% in 1996.
This section covers US presidents and the elections that chose them, including results and margins over the past century, the share of people who did not vote, the history of the political parties and the ages and lifespans of presidents. Each page writes out the full data and links to the election records behind it. Start with a timeline of US political parties, US presidents by age and years in office, presidential election results including non-voters, presidential election margins or deportations by president.
Not voting was the most common result in 11 of the 12 elections, peaking at 48% in 1996.

Franklin Roosevelt in 1936 scores highest, and Richard Nixon in 1968 is the only winner below zero.

Theodore Roosevelt was the youngest to take office at 42, Joe Biden was 82 when it was made, and Jimmy Carter lived longest, to 100.

Bill Clinton's second term is highest, with 6,922,376 deportations.

It traces the Federalists, Democratic-Republicans and Whigs, the Democrats from 1828 and the Republicans from 1856, plus 32 rows of parties and factions in all.
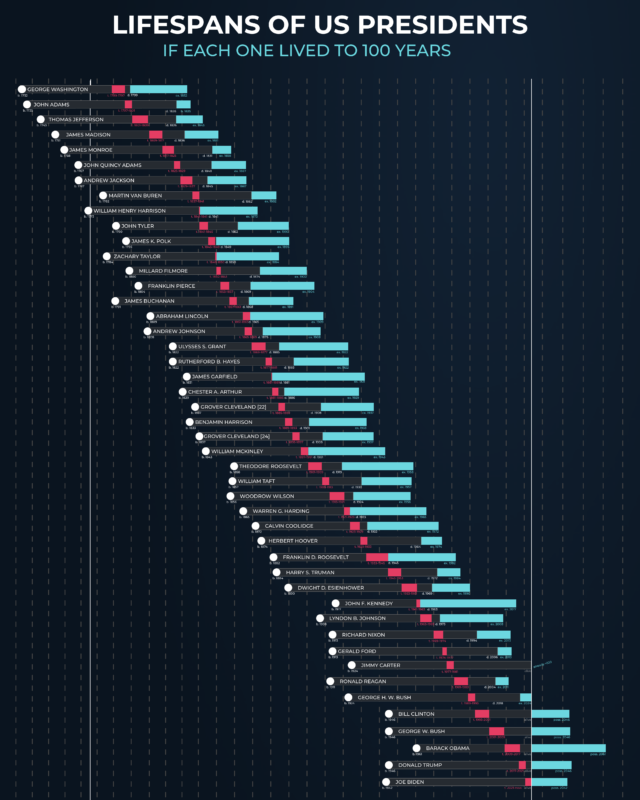
Kennedy at 46 to Jimmy Carter at 100.

Margins range from 0.24% in Georgia to 86.75% in D.C.; non-voting peaks at 45.57% in Oklahoma.
Give it a permanent page where people looking for your subject find it, with your name and a link to your site. Content marketers, agencies, designers and researchers all list here.