


Politics
Media Bias Chart, How AllSides Rates US News Outlets
The AllSides chart sorts US outlets into five columns from Left to Right; on version 9.2, CNN and NPR are Lean Left, Reuters and the BBC Center, and Fox…
These infographics cover politics and government, including media bias, Congress, peace and conflict, nuclear arsenals, women in power and public opinion across countries, with a section on presidents and elections. Each page credits the creator, sets out the data as text and explains how the source was put together, so readers can judge it for themselves. Start with the AllSides media bias chart, the richest members of Congress, the Global Peace Index, a map of female heads of state or a timeline of US political parties.
The AllSides chart sorts US outlets into five columns from Left to Right; on version 9.2, CNN and NPR are Lean Left, Reuters and the BBC Center, and Fox…
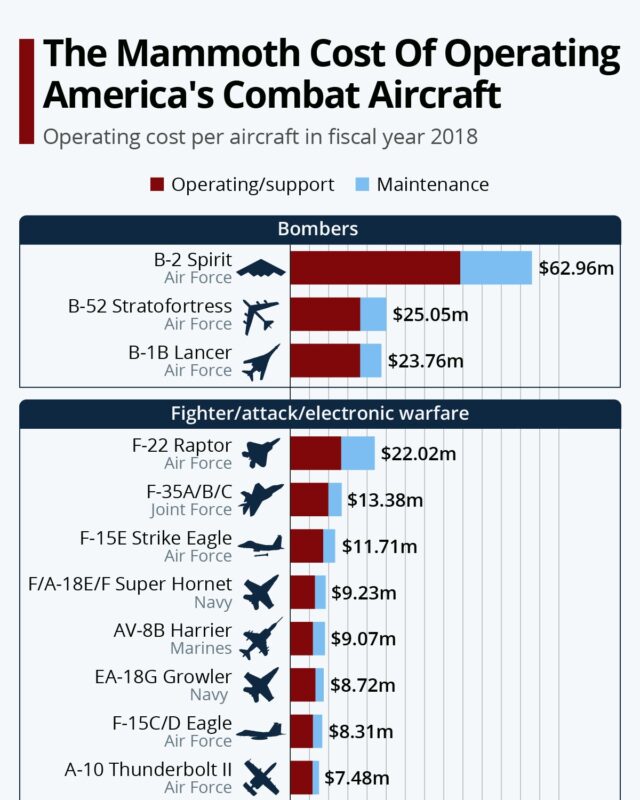
GAO figures for fiscal 2018 put the B-2 Spirit bomber at $44.27 million per aircraft, the B-52 and B-1B at about $18.2 million, the F-22 Raptor at $13.27…
The 26 infographics in this collection cover media bias and how the news talks about prejudice, money and power in the US Congress, war, peace, the cost of combat aircraft and nuclear weapons, prisons, deportations and refugees, women in power and the gap between men and women on the left-right scale, public opinion across countries, and US presidents and elections. Several rest on large surveys, such as Pew Research Center polling in 35 countries and World Values Survey data for 75 countries.
The AllSides Media Bias Chart, Version 9.2 in Full places 67 US news outlets in five columns from Left to Right, and AllSides says its ratings reflect perspective only, not accuracy or credibility. For money in politics, the Carbon Finance chart of the Richest Members of Congress, Top 10 by Net Worth in 2024 puts Senator Rick Scott first at an estimated US$327 million, using Quiver Quantitative data from July 2024.
On security, the Global Nuclear Arsenal in 2024, Warheads by Country and Status chart by Visual Capitalist (Voronoi) gives Russia an estimated 5,580 warheads and the U.S. 5,044, far ahead of China with 500. The Female Heads of State Map, Countries Led by Women to 2024 counts 11 countries with a female executive leader in October 2024 and marks firsts such as Sirimavo Bandaranaike of Sri Lanka, elected in 1960.
Two charts by u/ptrdo on Reddit treat not voting as a result in its own right. Presidential Election Results 1976 to 2020 Including Non-Voters shows "did not vote" as the largest result in 11 of the 12 elections, peaking at 48% in 1996. 2020 United States Presidential Election Voting and Non-Voters adds the state view, with margins from 0.24% in Georgia to 86.75% in D.C. and non-voting highest in Oklahoma at 45.57%.
Graphics on presidents, their ages and past election results are gathered in the Presidents and Elections section.
Russia, with an estimated 5,580 warheads as of 2024, according to the Visual Capitalist (Voronoi) chart Global Nuclear Arsenal in 2024, which uses Federation of American Scientists estimates. The U.S. is second with 5,044 and China third with 500.
El Salvador, at 624 per 100,000 people, in the World Charts (u/oscarleo0) graphic based on UNODC data averaged over 2020 to 2022. The United States holds the most prisoners in total, at 1,720,750.
Each page writes out the graphic in full as text, checks its claims against the sources listed on the page and corrects any mistakes in a note. Each page also credits the creator.
Give it a permanent page where people looking for your subject find it, with your name and a link to your site. Content marketers, agencies, designers and researchers all list here.