
Space and Astronomy
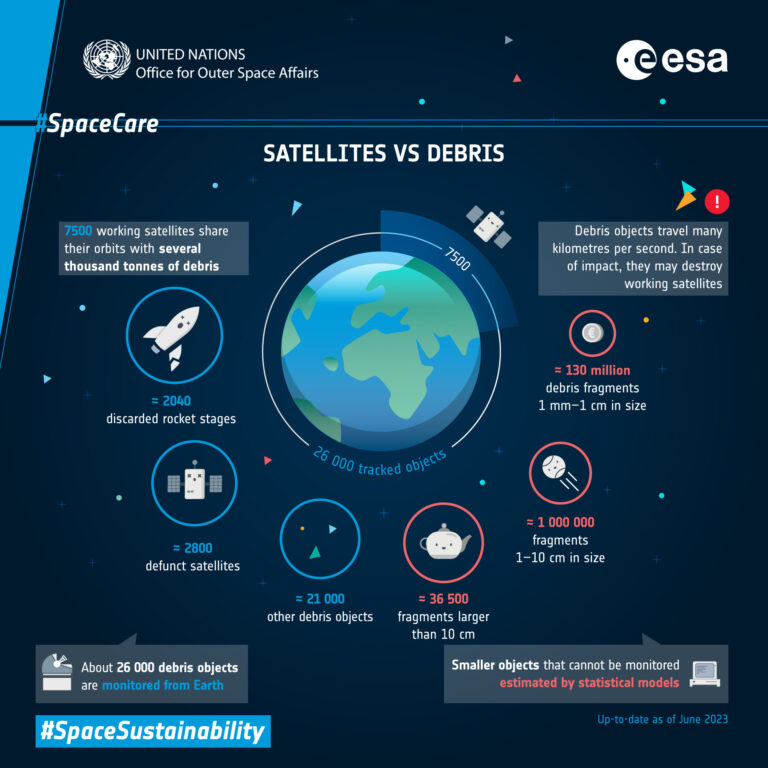
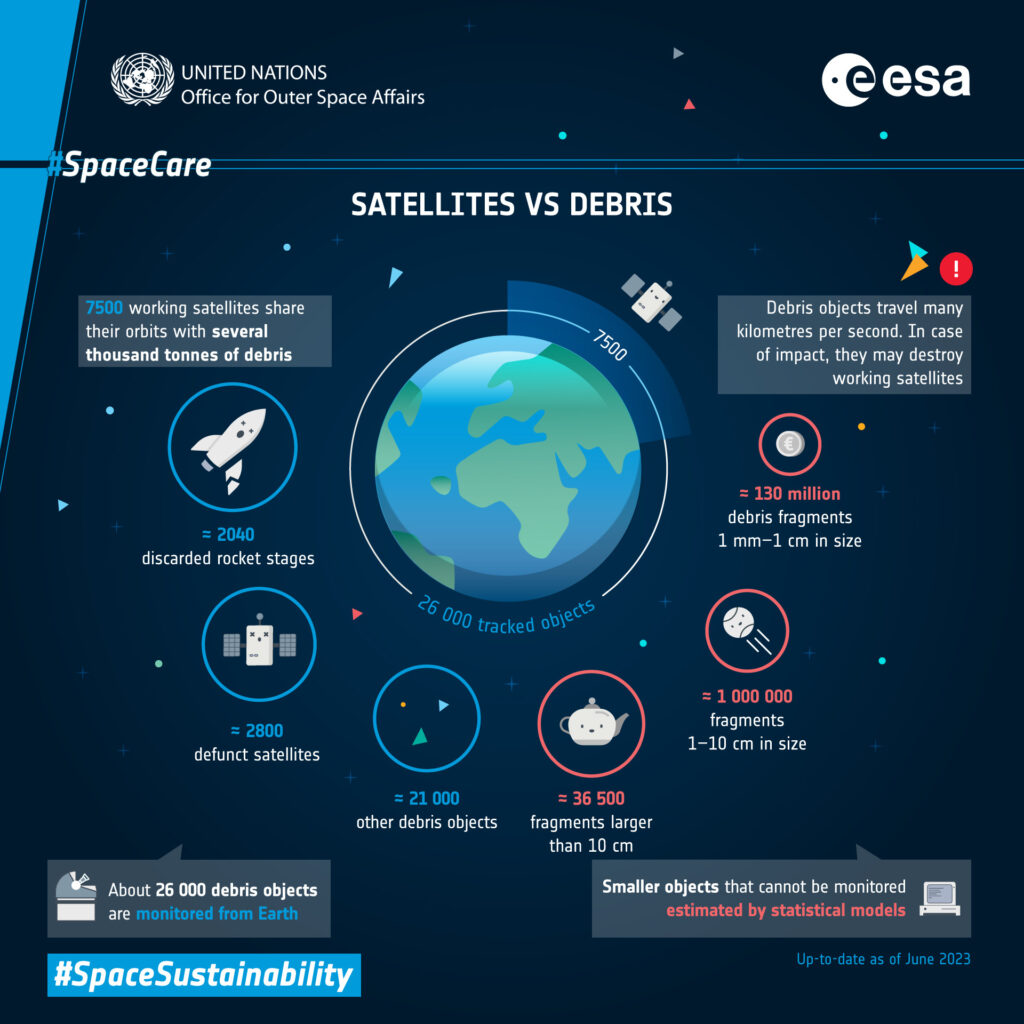
Space Debris, How Much Is in Orbit Around Earth
ESA's Space Debris Office counts about 47,330 objects tracked in Earth orbit and estimates 1.5 million pieces between 1 cm and 10 cm, plus 230 million…
This section covers space and how we reach it, including the history of the universe, rockets and launches, satellites, space suits, space stations and planets around other stars. Each page writes out every label on the graphic and checks figures against NASA, ESA and other published sources. Start with the timeline of the universe, rockets of the world drawn to scale, the Apollo A7L space suit diagram, NASA Earth observation satellites or every crewed space station since 1971. Space history, from early rockets to private stations, is covered alongside the science.
ESA's Space Debris Office counts about 47,330 objects tracked in Earth orbit and estimates 1.5 million pieces between 1 cm and 10 cm, plus 230 million…
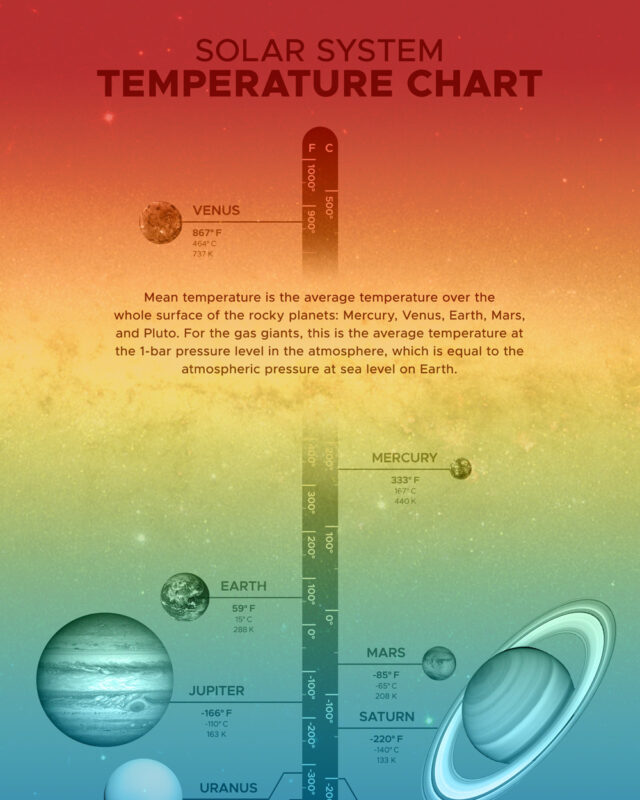
NASA puts the mean temperature of Venus at 867°F (464°C), hotter than Mercury at 333°F (167°C), even though Mercury is closer to the Sun.

The United States made 156, most of them SpaceX Falcon 9 flights, China 68 and Russia 17.
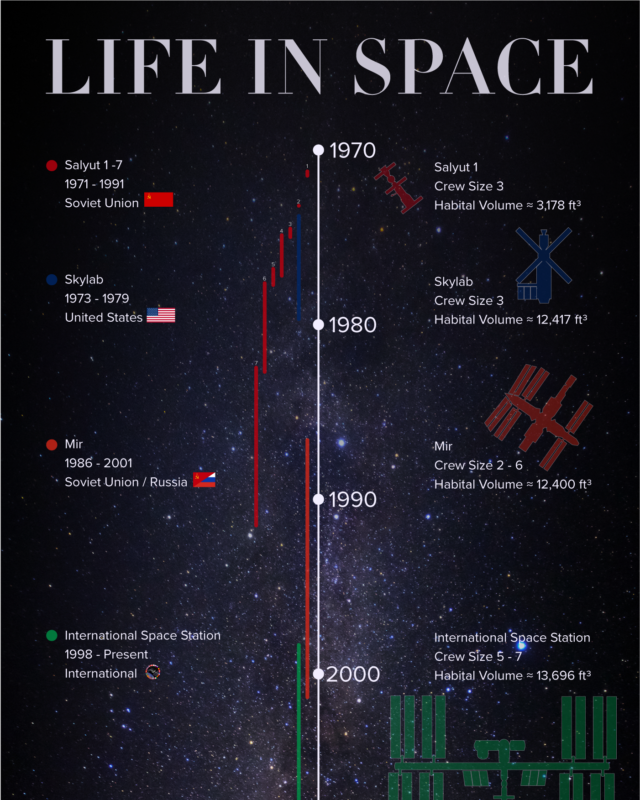
Skylab, Mir and the International Space Station followed, and people have lived in space without a break since 2 November 2000.
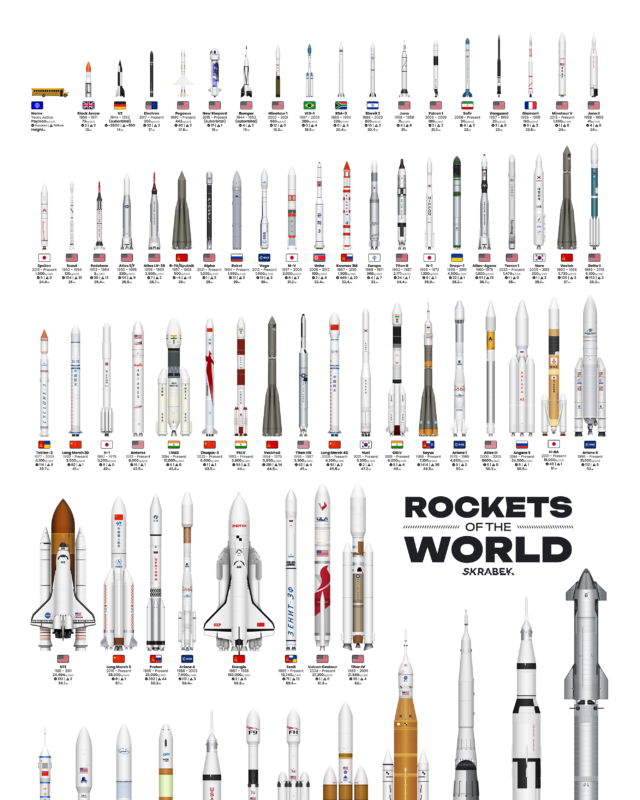
The biggest is SpaceX's Starship, 124.4 m tall, ahead of Saturn V at 111 m, while the smallest orbital rockets are under 20 m.

Yearly totals stayed below 250 objects until 2017, then rose to 1,274 in 2020 and a record 4,510 in 2025, driven by commercial satellite internet…

The fleet runs from Landsat, first launched in 1972, and the Terra, Aqua and Aura flagships of 1999 to 2004 to newer missions such as SWOT, PACE and NISAR.

In order came cosmic inflation in the first fraction of a second, the first protons and neutrons within a hundred-thousandth of a second, the first nuclei…
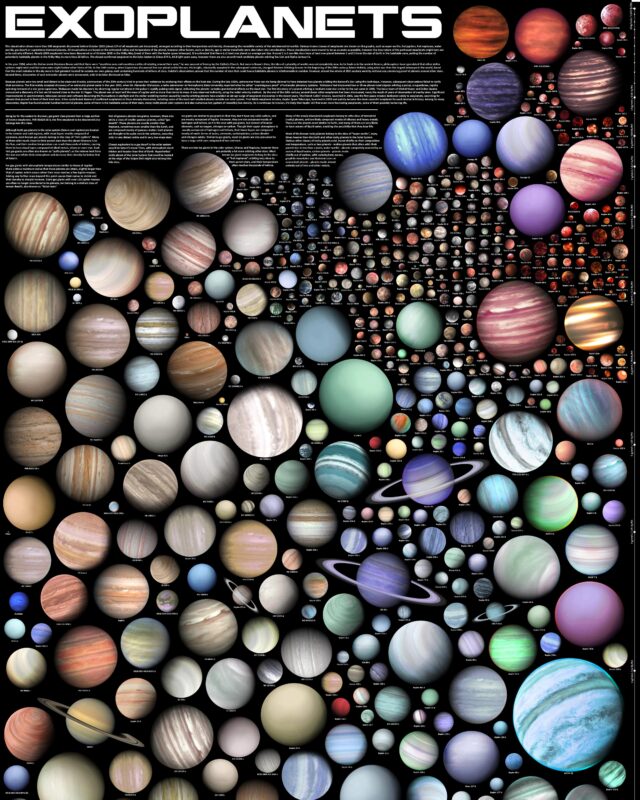
This exoplanets infographic by Martin Vargic of Halcyon Maps paints more than 500 of those known in 2015, sorted by temperature and density, with the…
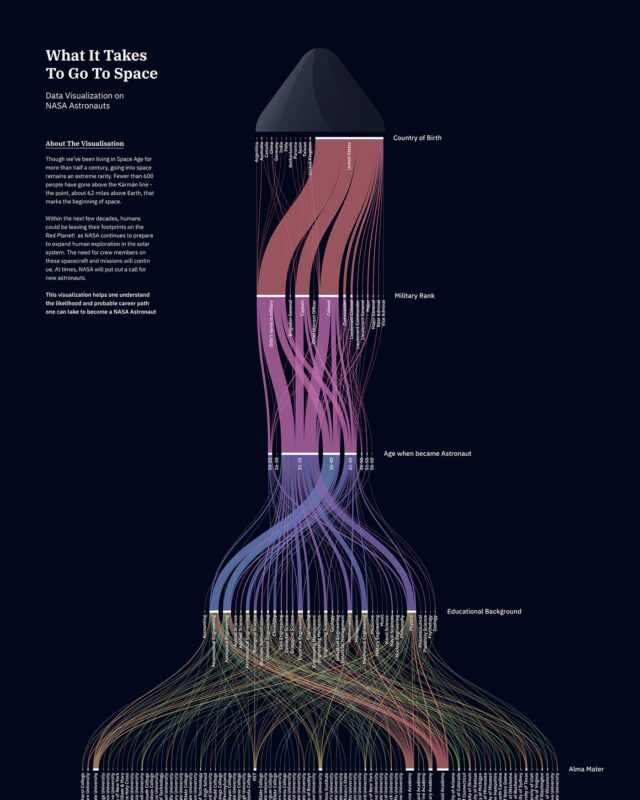
This NASA data visualization traces that path, and NASA's records of the 357 astronauts selected from 1959 to 2009 put numbers on it: 94% were born in the…
Give it a permanent page where people looking for your subject find it, with your name and a link to your site. Content marketers, agencies, designers and researchers all list here.