Key points from the chart
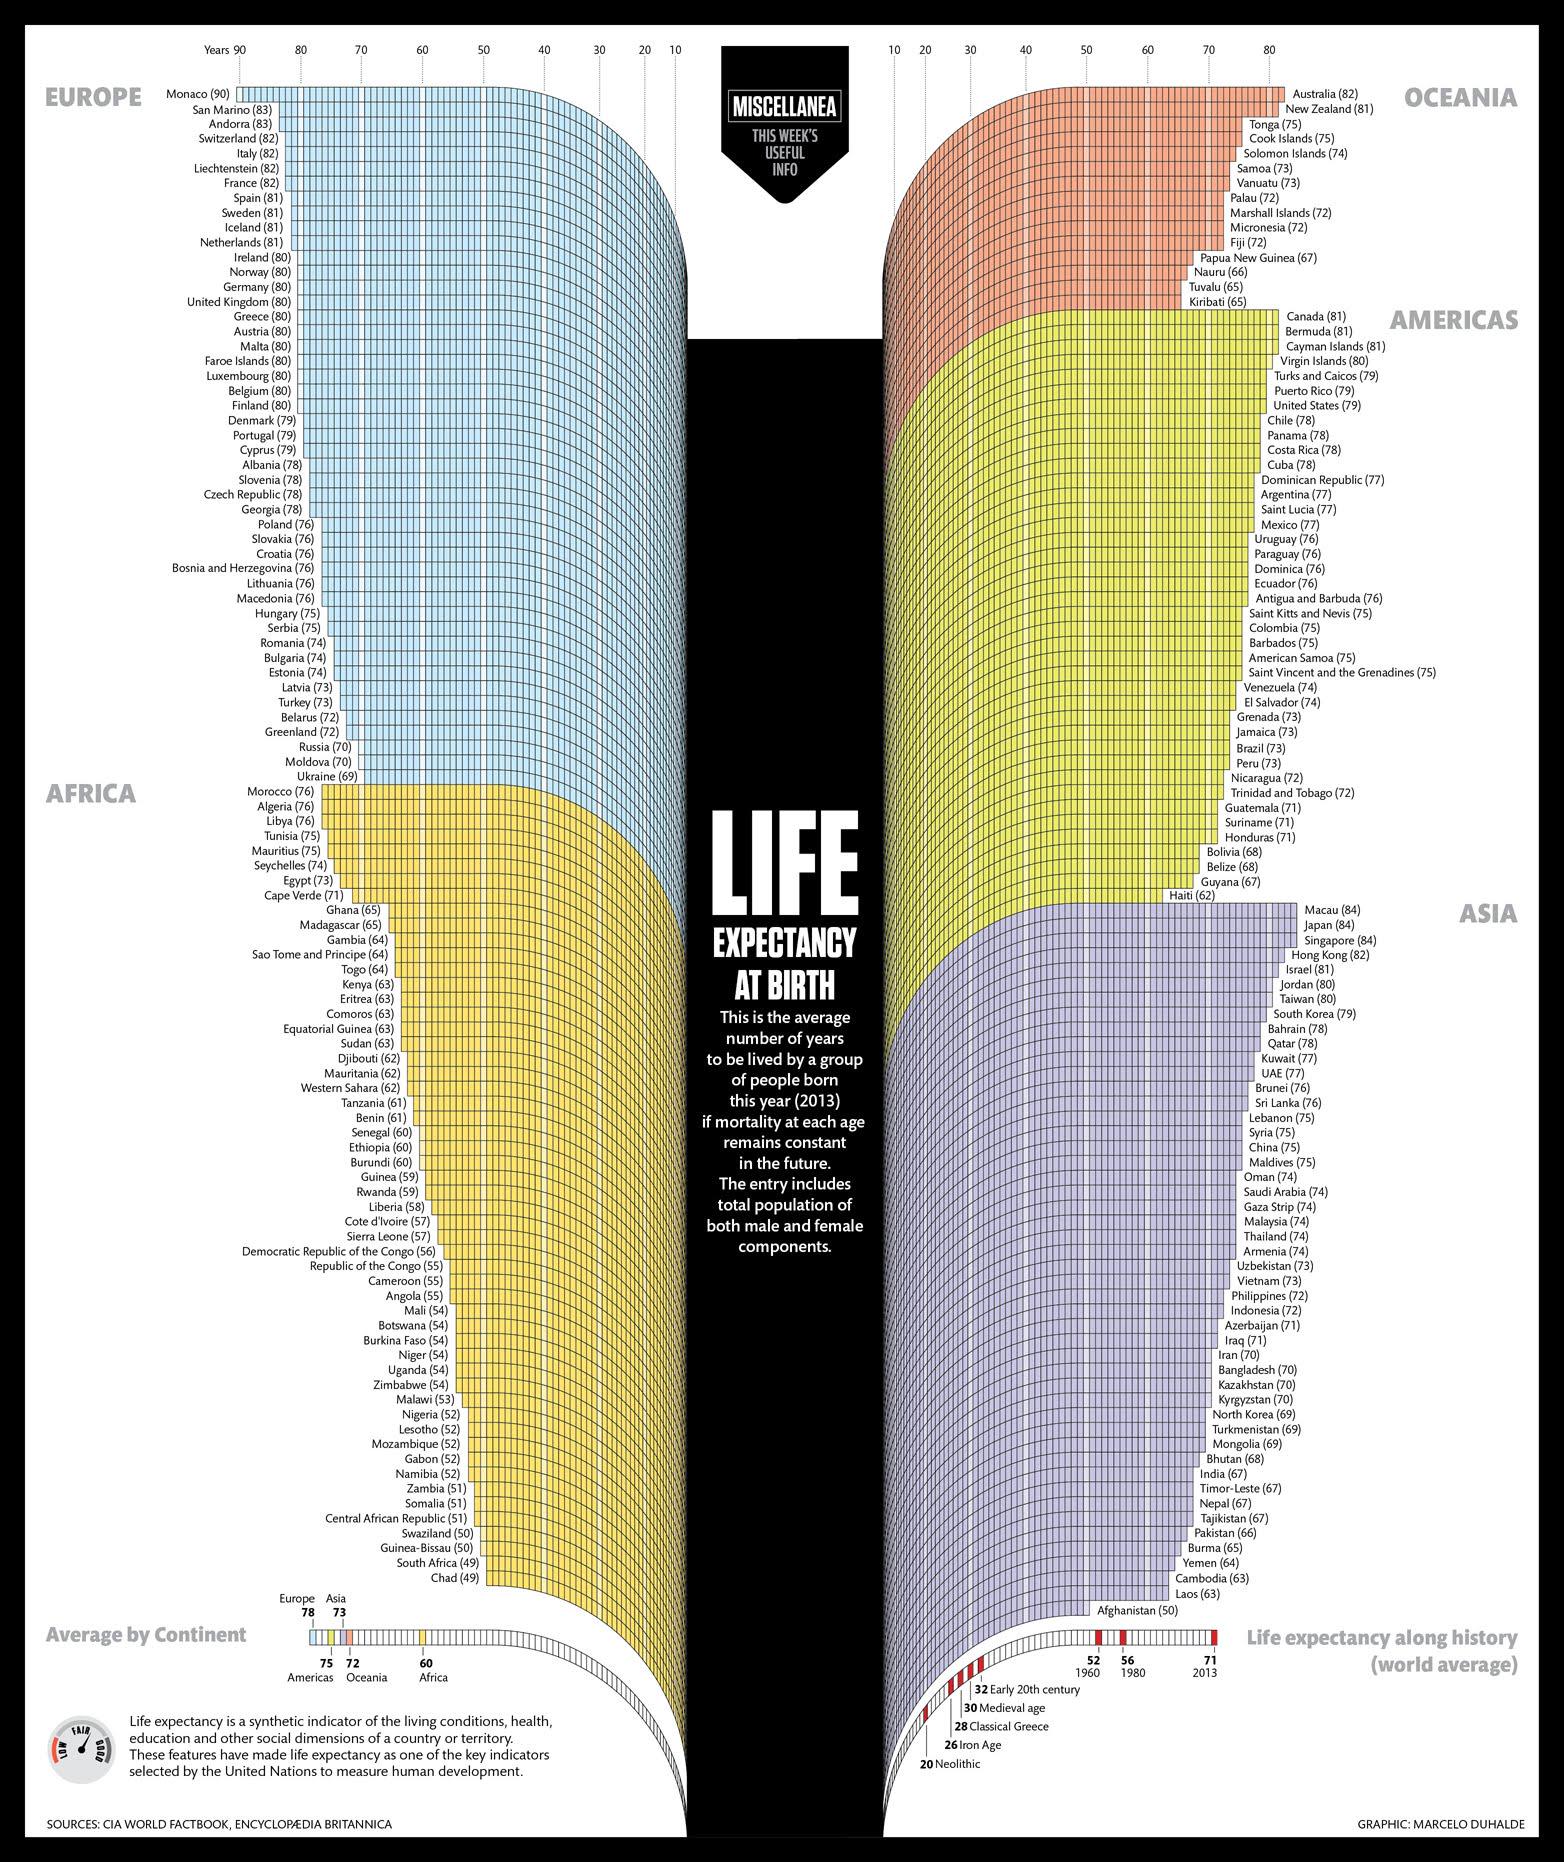
- The chart lists life expectancy at birth in 2013 for 204 countries and territories, grouped into Europe, Africa, Oceania, the Americas and Asia.
- Its continent averages are Europe 78, Americas 75, Asia 73, Oceania 72 and Africa 60 years.
- Monaco is highest at 90. Chad and South Africa are lowest at 49, with Afghanistan, Swaziland and Guinea-Bissau at 50.
- A side strip puts world average life expectancy at 20 years in the Neolithic, 32 in the early 20th century and 71 in 2013.
- United Nations estimates published by Our World in Data give similar continent figures for 2013, except for Oceania, and show every continent higher by 2023 [4].
Life expectancy by continent in text
Badge: Miscellanea, This week’s useful info. Title: Life Expectancy at Birth. Definition printed in the centre: This is the average number of years to be lived by a group of people born this year (2013) if mortality at each age remains constant in the future. The entry includes total population of both male and female components.
Each country is a bar measured in years, sorted from highest to lowest within its continent. Values as printed:
Europe: Monaco (90), San Marino (83), Andorra (83), Switzerland (82), Italy (82), Liechtenstein (82), France (82), Spain (81), Sweden (81), Iceland (81), Netherlands (81), Ireland (80), Norway (80), Germany (80), United Kingdom (80), Greece (80), Austria (80), Malta (80), Faroe Islands (80), Luxembourg (80), Belgium (80), Finland (80), Denmark (79), Portugal (79), Cyprus (79), Albania (78), Slovenia (78), Czech Republic (78), Georgia (78), Poland (76), Slovakia (76), Croatia (76), Bosnia and Herzegovina (76), Lithuania (76), Macedonia (76), Hungary (75), Serbia (75), Romania (74), Bulgaria (74), Estonia (74), Latvia (73), Turkey (73), Belarus (72), Greenland (72), Russia (70), Moldova (70), Ukraine (69).
Africa: Morocco (76), Algeria (76), Libya (76), Tunisia (75), Mauritius (75), Seychelles (74), Egypt (73), Cape Verde (71), Ghana (65), Madagascar (65), Gambia (64), Sao Tome and Principe (64), Togo (64), Kenya (63), Eritrea (63), Comoros (63), Equatorial Guinea (63), Sudan (63), Djibouti (62), Mauritania (62), Western Sahara (62), Tanzania (61), Benin (61), Senegal (60), Ethiopia (60), Burundi (60), Guinea (59), Rwanda (59), Liberia (58), Cote d’Ivoire (57), Sierra Leone (57), Democratic Republic of the Congo (56), Republic of the Congo (55), Cameroon (55), Angola (55), Mali (54), Botswana (54), Burkina Faso (54), Niger (54), Uganda (54), Zimbabwe (54), Malawi (53), Nigeria (52), Lesotho (52), Mozambique (52), Gabon (52), Namibia (52), Zambia (51), Somalia (51), Central African Republic (51), Swaziland (50), Guinea-Bissau (50), South Africa (49), Chad (49).
Oceania: Australia (82), New Zealand (81), Tonga (75), Cook Islands (75), Solomon Islands (74), Samoa (73), Vanuatu (73), Palau (72), Marshall Islands (72), Micronesia (72), Fiji (72), Papua New Guinea (67), Nauru (66), Tuvalu (65), Kiribati (65).
Americas: Canada (81), Bermuda (81), Cayman Islands (81), Virgin Islands (80), Turks and Caicos (79), Puerto Rico (79), United States (79), Chile (78), Panama (78), Costa Rica (78), Cuba (78), Dominican Republic (77), Argentina (77), Saint Lucia (77), Mexico (77), Uruguay (76), Paraguay (76), Dominica (76), Ecuador (76), Antigua and Barbuda (76), Saint Kitts and Nevis (75), Colombia (75), Barbados (75), American Samoa (75), Saint Vincent and the Grenadines (75), Venezuela (74), El Salvador (74), Grenada (73), Jamaica (73), Brazil (73), Peru (73), Nicaragua (72), Trinidad and Tobago (72), Guatemala (71), Suriname (71), Honduras (71), Bolivia (68), Belize (68), Guyana (67), Haiti (62).
Asia: Macau (84), Japan (84), Singapore (84), Hong Kong (82), Israel (81), Jordan (80), Taiwan (80), South Korea (79), Bahrain (78), Qatar (78), Kuwait (77), UAE (77), Brunei (76), Sri Lanka (76), Lebanon (75), Syria (75), China (75), Maldives (75), Oman (74), Saudi Arabia (74), Gaza Strip (74), Malaysia (74), Thailand (74), Armenia (74), Uzbekistan (73), Vietnam (73), Philippines (72), Indonesia (72), Azerbaijan (71), Iraq (71), Iran (70), Bangladesh (70), Kazakhstan (70), Kyrgyzstan (70), North Korea (69), Turkmenistan (69), Mongolia (69), Bhutan (68), India (67), Timor-Leste (67), Nepal (67), Tajikistan (67), Pakistan (66), Burma (65), Yemen (64), Cambodia (63), Laos (63), Afghanistan (50).
Average by continent: Europe 78, Americas 75, Asia 73, Oceania 72, Africa 60.
Life expectancy along history (world average): Neolithic 20, Iron Age 26, Classical Greece 28, Medieval age 30, Early 20th century 32, 1960 52, 1980 56, 2013 71.
Note on the graphic: Life expectancy is a synthetic indicator of the living conditions, health, education and other social dimensions of a country or territory. These features have made life expectancy one of the key indicators selected by the United Nations to measure human development. Sources: CIA World Factbook, Encyclopaedia Britannica. Graphic: Marcelo Duhalde.
How the continent figures compare with UN estimates
| Continent | Graphic, 2013 | UN estimate, 2013 | UN estimate, 2023 |
|---|---|---|---|
| Europe | 78 | 77.4 | 79.1 |
| Northern America | 75 (all Americas) | 79.1 | 79.6 |
| Latin America and the Caribbean | 75 (all Americas) | 74.4 | 75.7 |
| Asia | 73 | 72.4 | 74.6 |
| Oceania | 72 | 77.8 | 79.1 |
| Africa | 60 | 60.3 | 63.8 |
| World | 71 | 71.1 | 73.2 |
UN figures are from the World Population Prospects series as published by Our World in Data, rounded to one decimal [4]. They weight each country by its population. The graphic’s continent averages match a simple average of the countries it lists (for example 59.6 for Africa and 72.3 for Oceania by our sums), which treats a small island the same as a large country. That is why Oceania looks lower on the graphic: most entries are small Pacific islands with shorter lives than Australia and New Zealand, which hold most of the region’s people.
About the graphic
Marcelo Duhalde published the piece on Behance on 28 December 2013 [1]. Mic covered it in March 2014, noting Monaco’s 90, the US figure of 79 and the 49 years for Chad and South Africa [2]. Duhalde later became an associate creative director at the South China Morning Post [3].
Notes on this infographic
- The country values are CIA World Factbook estimates for 2013. Other sources differ for some countries. The UN puts Monaco at 85.1 for 2013 rather than 90, and Afghanistan at 62.2 rather than 50 [4].
- The historical strip gives 52 years for 1960 and 56 for 1980. UN estimates are 47.8 for 1960 and 60.5 for 1980 [4]. The figure for 2013, 71, matches.
- Some groupings are unusual: Greenland, Georgia and Turkey sit under Europe, and American Samoa under the Americas.
- Several names have since changed. Swaziland is now Eswatini and Macedonia is North Macedonia.
Questions about life expectancy by continent
Which continent has the lowest life expectancy?
Africa. The graphic gives it an average of 60 years for 2013, and UN estimates put Africa at 60.3 years in 2013 and 63.8 in 2023, the lowest of any continent in both years [4].
Which continent has the highest life expectancy?
On the graphic, Europe, with an average of 78 years in 2013. In UN estimates for 2023, Northern America (79.6), Europe (79.1) and Oceania (79.1) are almost level at the top [4].
Which continent has countries where the life expectancy is below 49 years?
None on this graphic. The lowest values shown are 49 years, for Chad and South Africa, both in Africa. Afghanistan in Asia and Swaziland and Guinea-Bissau in Africa follow at 50.
Sources
- Marcelo Duhalde, Life Expectancy at Birth, Behance, published 28 December 2013, the creator’s post of this graphic (profile).
- Tom McKay, This Chart Predicts Life Expectancy Based on Where You Were Born, Mic, 5 March 2014.
- TK Sajeev Kumar, Marcelo Duhalde’s Graphics Bring Journalistic Investigations to Life, Nightingale (Data Visualization Society), 13 June 2023.
- Our World in Data, Life expectancy at birth, based on UN World Population Prospects (regional and country series, downloaded October 2026).
Last reviewed 30 October 2026