Health and safety statistics for Great Britain show that 1.8 million workers were suffering from an illness caused or made worse by their work in 2025/26, and 126 workers were killed in accidents at work. The Health and Safety Executive (HSE) also counts 688,000 workers injured at work, 39.6 million working days lost and £24.6 billion a year in costs to Britain.
Key health and safety statistics for Great Britain
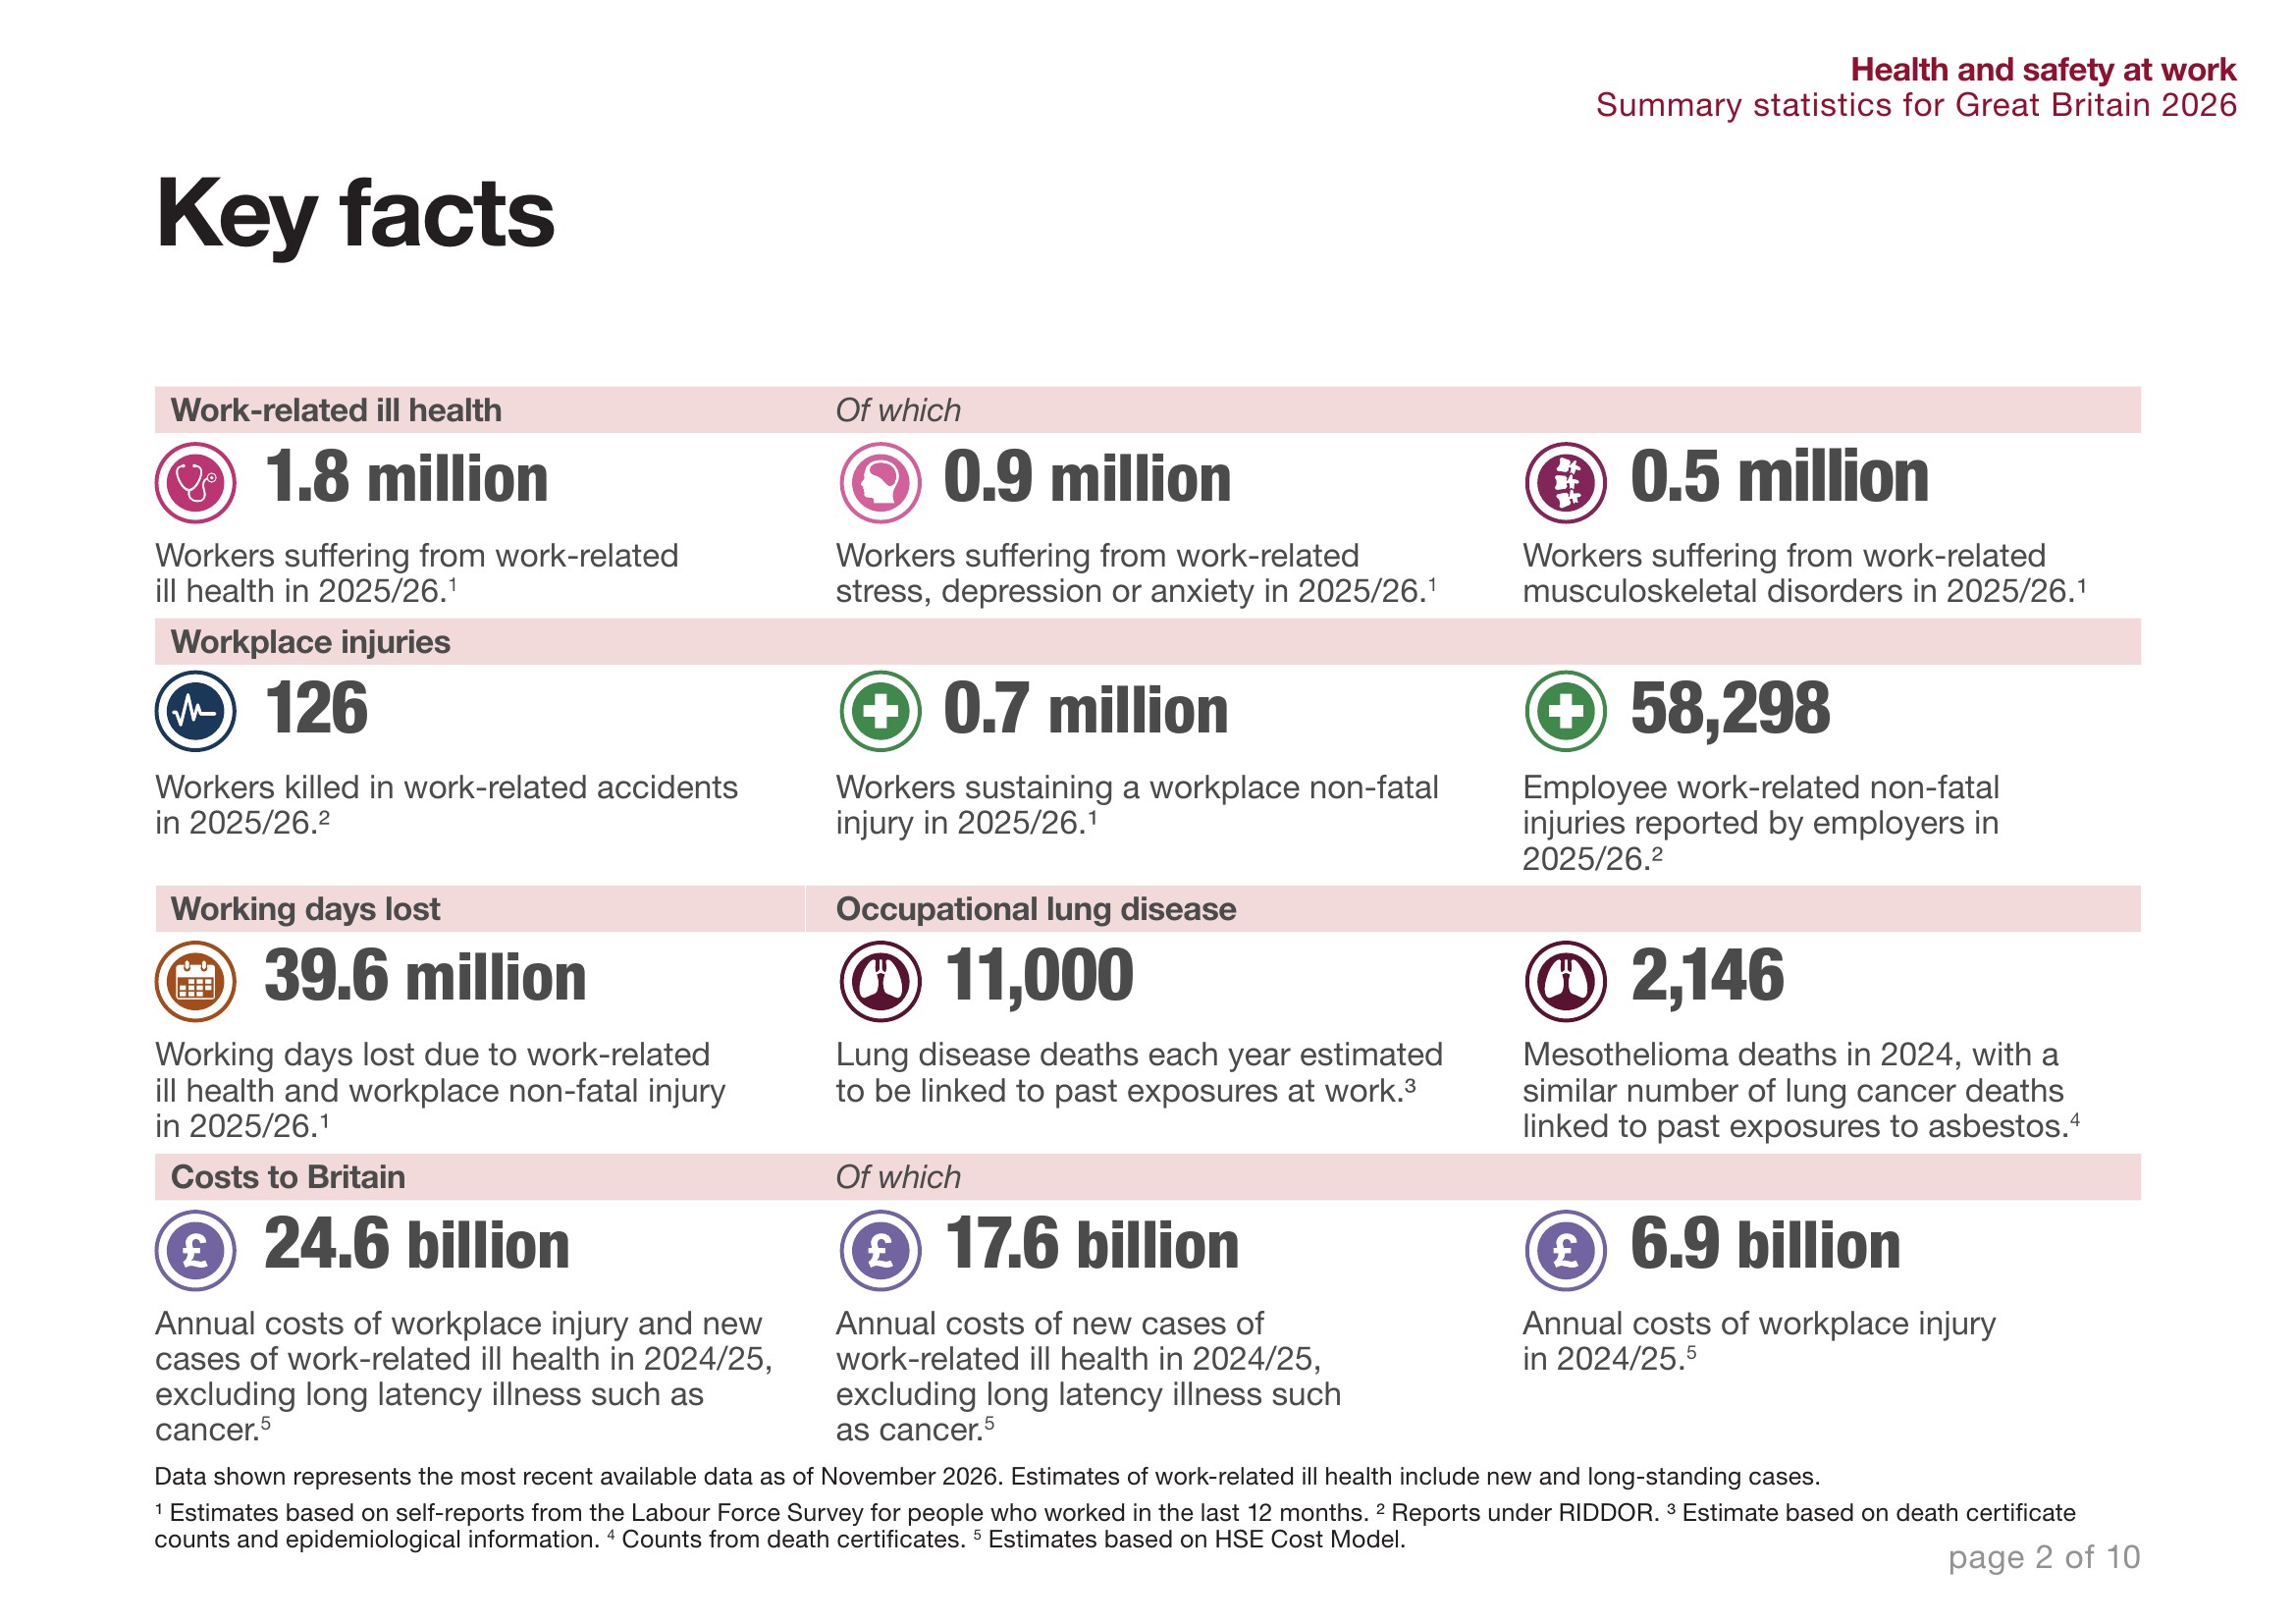
The headline HSE figures for 2025/26 are 1.8 million workers with work-related ill health, 126 worker deaths and 688,000 non-fatal injuries, according to HSE’s key figures for Great Britain, published on 19 November 2026 with data up to March 2026. The main figures are below.
| Measure | Latest figure | Year |
|---|---|---|
| Workers suffering from work-related ill health (new and long-standing) | 1.8 million | 2025/26 |
| Workers with work-related stress, depression or anxiety | 891,000 | 2025/26 |
| Workers with a work-related musculoskeletal disorder | 477,000 | 2025/26 |
| Workers killed in work-related accidents | 126 | 2025/26 (provisional) |
| Workers injured at work (self-reported) | 688,000 | 2025/26 |
| Employee injuries reported by employers under RIDDOR | 58,298 | 2025/26 |
| Working days lost to work-related ill health and injury | 39.6 million | 2025/26 |
| Lung disease deaths each year linked to past exposure at work | 11,000 | Annual estimate |
| Mesothelioma deaths | 2,146 | 2024 |
| Cost of workplace injury and new cases of ill health | £24.6 billion | 2024/25 |
The HSE infographic above brings these key facts together on a single page of its summary statistics booklet. The figures cover Great Britain (England, Scotland and Wales). Northern Ireland has its own regulator and publishes its own figures, so the numbers here are not for the whole UK.
How many workers are made ill by their work
An estimated 1.8 million workers in Great Britain were suffering from work-related ill health in 2025/26, and 699,000 of them were new cases that year. HSE’s work-related ill health statistics put the rate at 5,140 cases per 100,000 workers, which is roughly 5 in every 100 workers.
Mental health is the largest part of it. Stress, depression or anxiety made up 49% of all cases (891,000 workers), musculoskeletal disorders such as back pain 26% (477,000) and other types of illness 24% (441,000), according to the same HSE page. HSE says the rate has been broadly flat over the last four years but is still higher than before the pandemic.
These estimates come from what workers say in the Labour Force Survey, so they count illnesses people believe were caused or made worse by their job. HSE’s summary statistics booklet also estimates that about 13,000 deaths a year are linked to past exposure at work, mainly to chemicals or dust.
Work-related stress, depression or anxiety
Work-related stress, depression or anxiety affected 891,000 workers in Great Britain in 2025/26, a rate of 2,530 per 100,000 workers. HSE’s work-related stress statistics report counts 357,000 new cases that year and 18.2 million working days lost, an average of 20.4 days off for each case.
Stress causes more lost time than any other work-related illness. It accounted for 49% of all work-related ill health but 52% of all working days lost to ill health in 2025/26, according to HSE. HSE defines work-related stress as a harmful reaction people have to undue pressures and demands placed on them at work, and the main causes workers gave were workload pressures (including tight deadlines and too much responsibility) and a lack of support from managers.
Some jobs carry a much higher risk. Over 2023/24 to 2025/26 the average rate across all industries was 1,990 per 100,000 workers, against 3,320 in public administration and defence, 2,560 in human health and social work and 2,450 in education, the same HSE report shows. Women had a higher rate (3,160 per 100,000 workers) than men (1,940). HSE notes that the occupations with higher rates often involve a lot of contact with the public and many are in the public sector. You can find HSE’s guidance for employers and workers on its stress and mental health at work pages.
Musculoskeletal disorders at work
Work-related musculoskeletal disorders, which are injuries and pain in the back, joints and muscles, affected 477,000 workers in Great Britain in 2025/26. HSE’s musculoskeletal disorders statistics report breaks this down into 182,000 cases mainly affecting the back, 177,000 the upper limbs or neck and 119,000 the lower limbs.
There were 172,000 new cases in the year and 7.5 million working days lost, an average of 15.7 days per case, according to the same report. The rate has been broadly flat over the last four years and is similar to before the pandemic. By industry, these disorders are most common in construction and in transportation and storage, and by job they are highest in skilled trades, caring, leisure and other service work, process, plant and machine operatives and elementary occupations.
How many people are killed at work each year
126 workers were killed in work-related accidents in Great Britain in 2025/26, according to HSE’s work-related fatal injury statistics. A further 104 members of the public were killed in work-related accidents. The 2025/26 figures are provisional and HSE will finalise them in July 2027.
Construction had the most worker deaths (25), followed by agriculture, forestry and fishing (22), manufacturing (18) and transportation and storage (15). Falls from height were the most common cause, with 31 deaths, then being struck by a moving vehicle (24), struck by a moving object (21), trapped by something collapsing or overturning (18) and contact with moving machinery (10).
Older workers are over-represented. 40 of the 126 workers killed were aged 60 or over, the same HSE page shows. Over the long term the rate of fatal injury has fallen, though HSE says the decline has slowed in recent years.
Non-fatal workplace injuries
688,000 workers in Great Britain were injured at work in 2025/26, based on what workers told the Labour Force Survey, and employers reported 58,298 non-fatal injuries to employees under RIDDOR. HSE’s non-fatal injury statistics show that 543,000 of those injuries led to up to 7 days off work and 145,000 to more than 7 days.
The most common accidents in the injuries employers reported were slips, trips or falls on the same level (29%), handling, lifting or carrying (18%), acts of violence (11%), being struck by a moving object (11%) and falls from height (8%). The self-reported injury rate was 2,060 per 100,000 workers in 2025/26, broadly flat over the last four years and similar to before the pandemic, while the employer-reported rate of 203 per 100,000 employees continues to fall.
The two counts differ because employers only have to report the more serious injuries under the Reporting of Injuries, Diseases and Dangerous Occurrences Regulations (RIDDOR), generally those causing more than 7 days off work or on a set list, such as most fractures and amputations, as HSE’s specified injuries guidance sets out. HSE also estimates that employers report only around half of the non-fatal injuries they should, which is why it treats the Labour Force Survey as the more complete measure.
Occupational lung disease and asbestos
Around 11,000 people die each year from lung diseases linked to past exposure at work, HSE estimates in its occupational lung disease figures. Chronic obstructive pulmonary disease (COPD) accounts for 36% of these deaths, lung cancer not related to asbestos 23%, asbestos-related lung cancer 19%, mesothelioma 19% and other diseases 3%.
These deaths mostly reflect working conditions decades ago, because lung diseases take a long time to develop after exposure. Mesothelioma, a cancer caused by breathing in asbestos fibres, killed 2,146 people in Great Britain in 2024, down from 2,255 in 2023 and below the average of 2,508 a year over 2011 to 2020, according to HSE’s mesothelioma statistics. HSE says there is a similar number of lung cancer deaths linked to past asbestos exposure, that over 70% of mesothelioma deaths now occur in people aged over 75, and that men who worked in the building industry when asbestos was widely used remain most at risk.
Working days lost to work-related ill health and injury
39.6 million working days were lost in Great Britain in 2025/26 to work-related ill health and workplace injuries. HSE’s working days lost statistics put 35.0 million of those days down to ill health and 4.6 million to injuries.
Each person affected took around 16.7 days off on average, ranging from 6.7 days for an injury to 19.4 days for an illness, 15.7 days for a musculoskeletal disorder and 20.4 days for stress, depression or anxiety. That works out at 1.42 days lost for every worker in 2025/26, a level HSE says has been broadly flat over the last four years but is higher than before the pandemic.
How much workplace injury and ill health costs
Workplace injuries and new cases of work-related ill health cost Great Britain an estimated £24.6 billion in 2024/25, according to HSE’s costs to Britain estimates. Ill health made up about 72% of that (£17.6 billion) and injuries about 28% (£6.9 billion).
Most of the cost falls on the workers themselves. HSE puts £14.5 billion on individuals, £5.4 billion on government and £4.6 billion on employers. The figures include financial costs, such as lost production and healthcare, and a value for the human cost to people’s quality of life. They leave out long-latency illnesses such as cancer, so the true cost of past working conditions is higher. HSE says the total is up £0.6 billion in real terms on 2023/24 and has settled at a higher level since the pandemic, mainly because of rising ill health costs.
Which industries have the highest rates
Public administration and defence, human health and social work, and education have significantly higher rates of work-related ill health than the average across all industries, according to HSE’s summary statistics for 2026, based on 2023/24 to 2025/26.
Injuries follow a different pattern. Agriculture, forestry and fishing, accommodation and food services, transportation and storage, construction, and wholesale and retail trade (including motor vehicle repair) all have significantly higher rates of non-fatal injury than average, the same booklet shows. Public-sector and public-facing jobs carry more of the ill health burden, while physical and outdoor work carries more of the injury risk.
Where HSE statistics come from
HSE’s figures combine several sources, mainly the Labour Force Survey for self-reported ill health and injury, RIDDOR reports from employers, death certificates and HSE’s own cost model. They are Accredited Official Statistics, published every November, and the next update is due in November 2027, as HSE’s 2025 to 2026 annual release and its booklet explain.
Two points help when comparing figures. Ill health counts include both new and long-standing cases unless HSE says new cases only. Fatal injury figures cover all workers, employed and self-employed, while the employer-reported non-fatal injury figures cover employees only. HSE also advises caution with 2019/20 to 2021/22 because the pandemic affected the data.
Questions about health and safety statistics
How many people die at work each year in the UK?
126 workers were killed in work-related accidents in Great Britain in 2025/26, according to provisional HSE figures, and a further 104 members of the public died in work-related accidents. These figures cover England, Scotland and Wales. Northern Ireland reports separately.
What is the most common workplace injury?
Slips, trips or falls on the same level are the most common cause of injuries reported by employers, at 29% in 2025/26, according to HSE. Handling, lifting or carrying is next at 18%. Falls from height cause the most worker deaths.
What is the biggest cause of work-related ill health?
Stress, depression or anxiety is the biggest cause, accounting for 49% of work-related ill health in 2025/26 (891,000 workers) and 52% of working days lost to ill health, according to HSE. Musculoskeletal disorders are second at 26%.
How many working days are lost to work-related stress?
18.2 million working days were lost to work-related stress, depression or anxiety in Great Britain in 2025/26, an average of 20.4 days for each person affected, according to HSE.
Which industry has the most workplace deaths?
Construction had the most worker deaths in Great Britain in 2025/26, with 25 of the 126, followed by agriculture, forestry and fishing with 22, according to HSE’s provisional figures.
Are all workplace injuries reported to HSE?
No. Employers only have to report the more serious injuries under RIDDOR, and HSE estimates that employers report only around half of the non-fatal injuries they should. That is why the self-reported figure of 688,000 injured workers is far higher than the 58,298 injuries employers reported.
When are HSE statistics published?
HSE publishes its annual health and safety statistics for Great Britain every November. The 2025/26 figures were released on 19 November 2026 and the next update is due in November 2027.
Sources
- Health and Safety Executive, Health and safety at work, Summary statistics for Great Britain 2026 (booklet, November 2026, the infographic is its Key facts page)
- Health and Safety Executive, Key figures for Great Britain (2025/26)
- Health and Safety Executive, Work-related ill health and occupational disease in Great Britain
- Health and Safety Executive, Work-related stress, depression or anxiety statistics in Great Britain, 2026
- Health and Safety Executive, Work-related musculoskeletal disorders statistics in Great Britain, 2026
- Health and Safety Executive, Work-related fatal injuries in Great Britain
- Health and Safety Executive, Non-fatal injuries at work in Great Britain
- Health and Safety Executive, Mesothelioma statistics for Great Britain, 2026
- Health and Safety Executive, Working days lost in Great Britain
- Health and Safety Executive, Costs to Great Britain of workplace injuries and new cases of work-related ill health, 2024/25
- Health and Safety Executive, Specified, reportable injuries to workers
- GOV.UK, Health and Safety statistics, 2025 to 2026 annual release
Contains public sector information published by the Health and Safety Executive and licensed under the Open Government Licence v3.0. Its use here does not imply any endorsement by HSE.