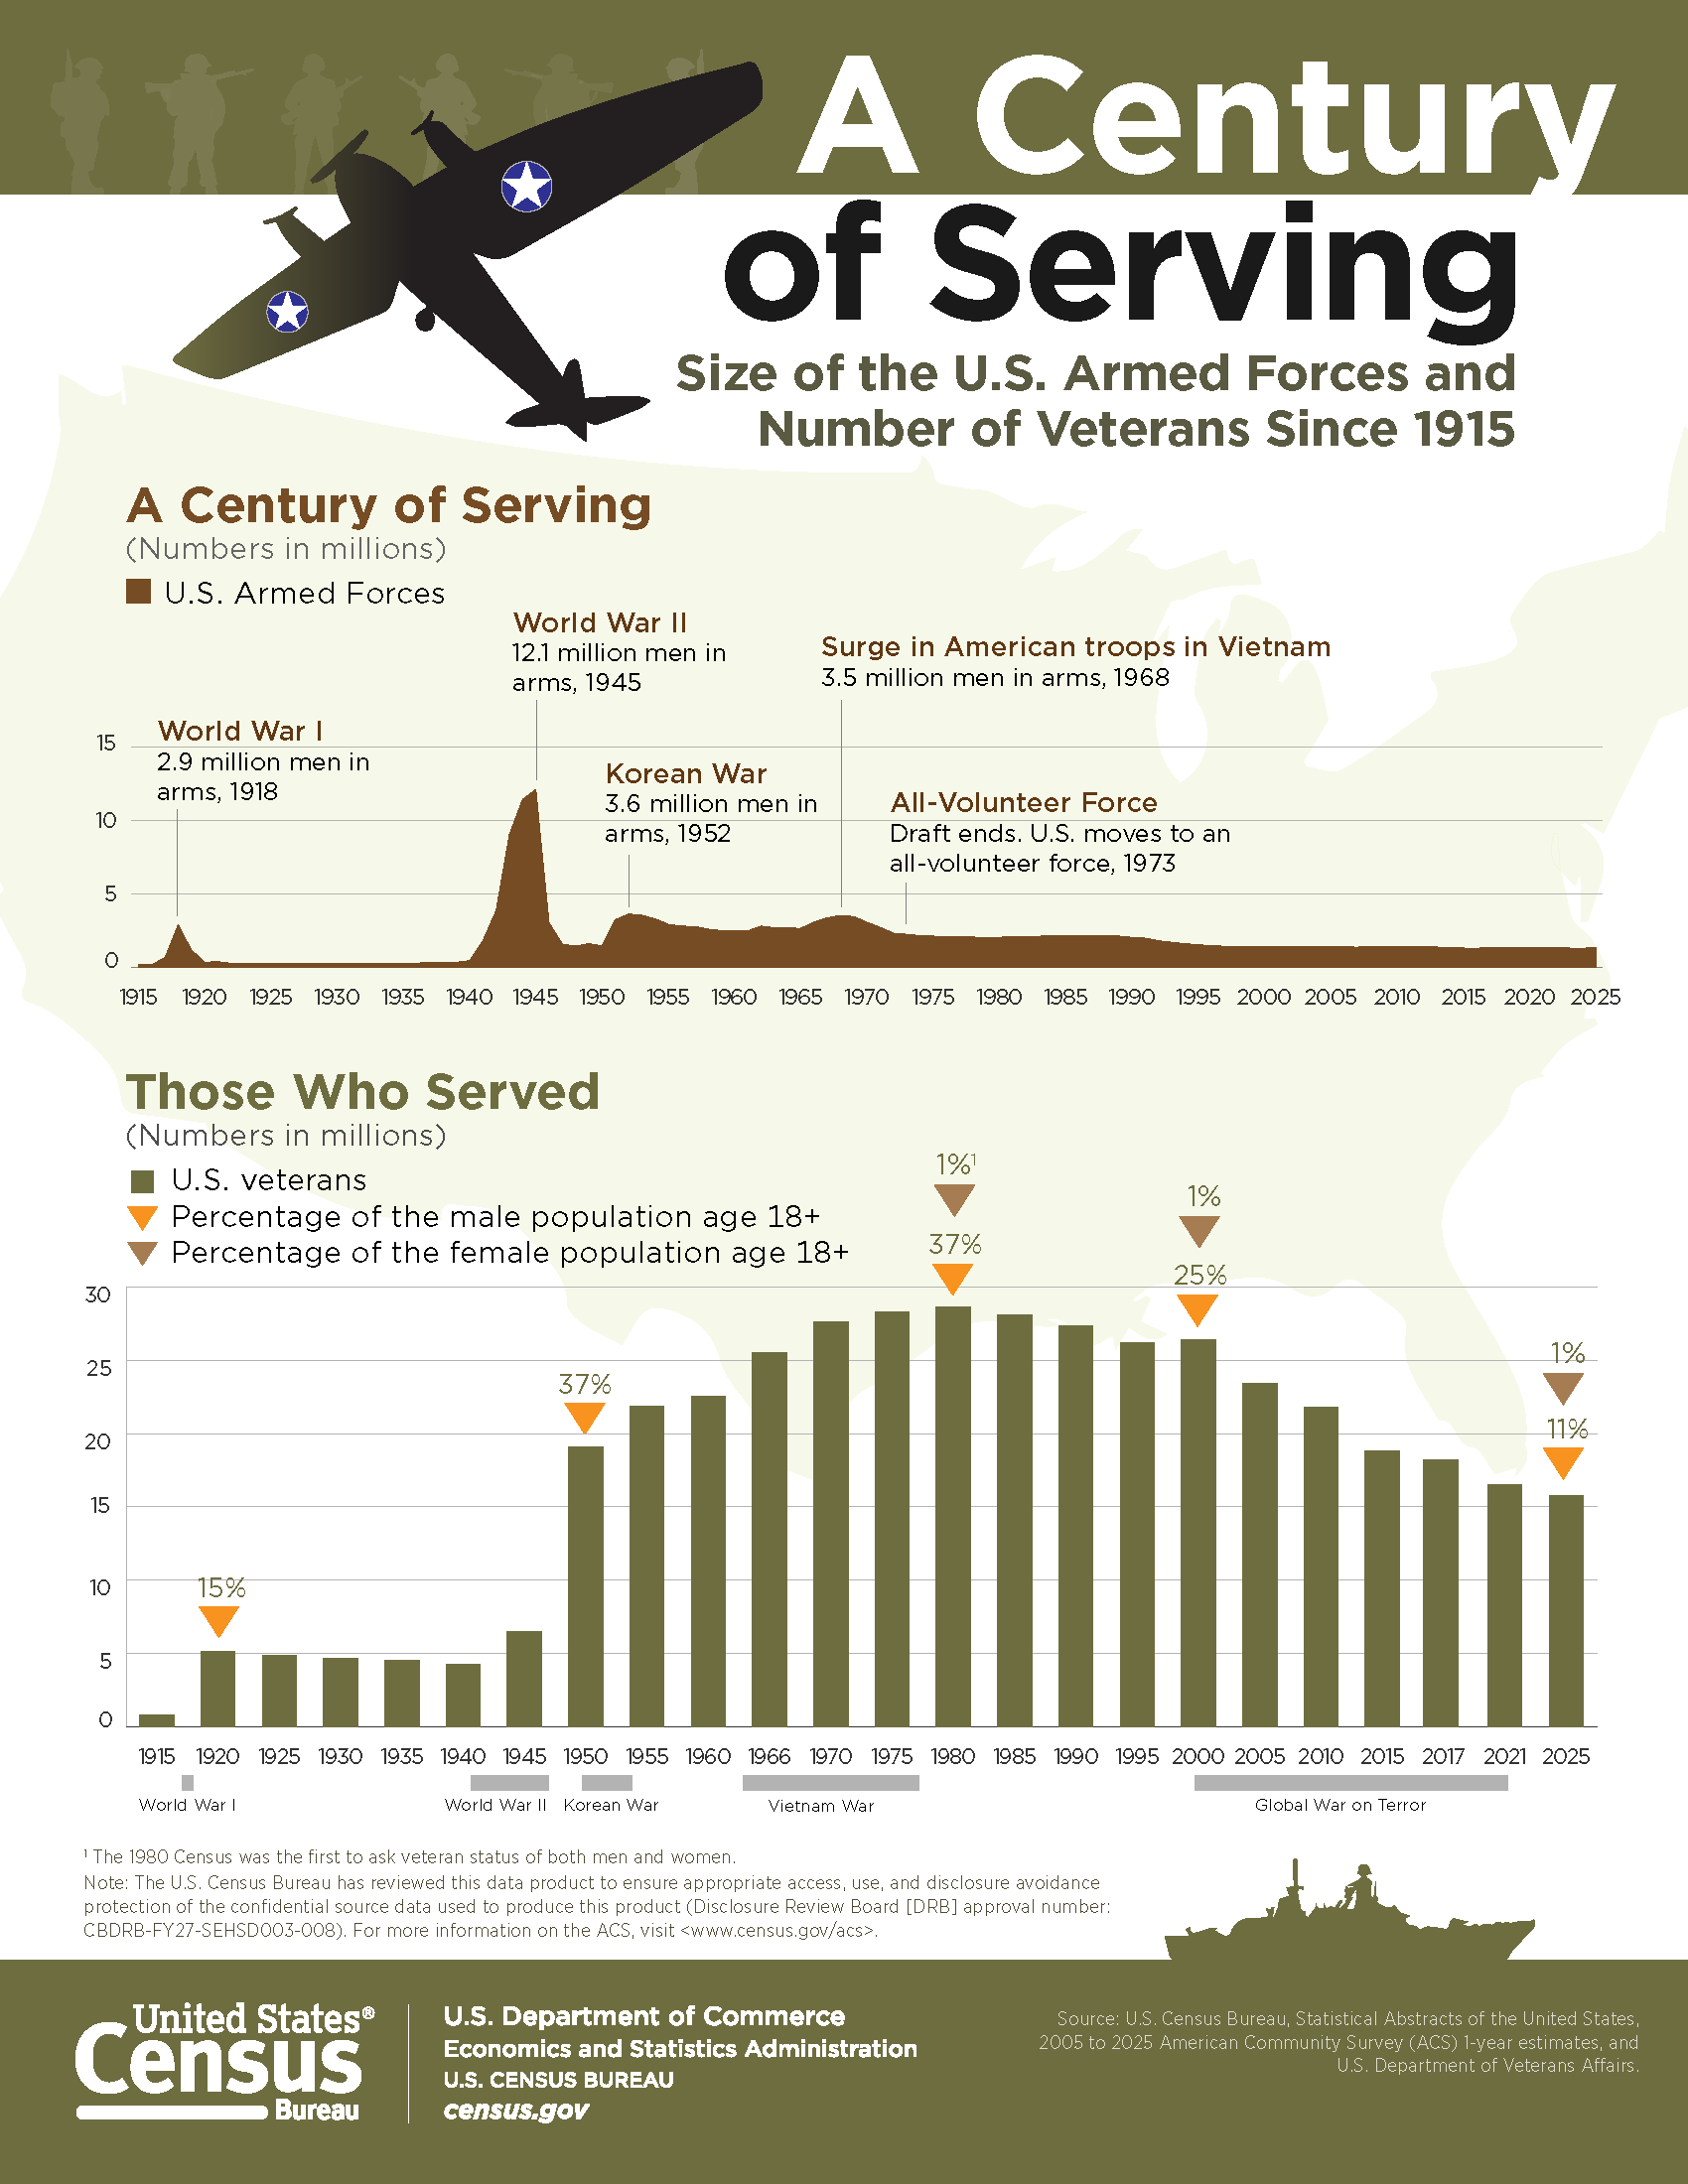
There were about 15.7 million military veterans in the US in 2025, according to the Census Bureau, which is 5.9% of adults. The Department of Veterans Affairs puts the figure higher, at about 17.6 million. Either way the number is falling, because the armed forces that held 12.1 million people at the end of World War II now have about 1.3 million on active duty.
How many veterans are in the US
About 15.7 million Americans were veterans in 2025, the latest year of Census survey data. That is 5.9% of the civilian population aged 18 and over, according to the Census Bureau’s Veterans Day 2026 facts, which come from the 2025 American Community Survey.
The count has been dropping for decades. The Census Bureau put it at 15.8 million, or 6.1% of adults, in 2023, and at roughly 18 million, about 7% of adults, in 2018 in its report Those Who Served.
Women make up a growing share. There were 1.7 million female veterans in 2024, 11.1% of all veterans, by the Census Bureau’s count.
Why the Census and VA veteran numbers differ
The VA’s figure is about 1.9 million higher because it comes from a projection model built mainly on military and VA records, while the Census figure comes from what people say in a household survey. The VA’s VetPop2023 model estimated 18,267,000 living veterans on 30 September 2023, and its national projection table gives 17,588,000 for September 2025 and 17,260,000 for September 2026.
The VA’s description of the model says it starts from people in its records with federal active-duty service other than training, then blends in American Community Survey estimates for older veterans, whose records are less complete. The Census number counts civilians aged 18 and over who tell the survey they served. So the two are measuring the same group in different ways.
In practice, the VA number is the one used for planning veterans’ services, and the Census number is the one to use when you compare veterans with the rest of the population, for example on income, education or disability, because those figures come from the same survey.
How big the US military has been since 1915
The US armed forces peaked at 12.1 million people in 1945, at the end of World War II, according to the Census Bureau’s A Century of Serving, which draws on the Statistical Abstract of the United States and VA data. Every later war was fought with a far smaller force, and today about 1.3 million people serve on active duty.
| Year | What was happening | People in the armed forces |
|---|---|---|
| 1918 | World War I | 2.9 million |
| 1945 | World War II | 12.1 million |
| 1952 | Korean War | 3.6 million |
| 1968 | Height of the Vietnam War | 3.5 million |
| 1973 | The draft ends and the US moves to an all-volunteer force | Falling |
| 2026 | Today | 1,325,000 on active duty |
The first five rows are from the Census Bureau’s A Century of Serving. The 2026 figure is from the Census Bureau’s U.S. Armed Forces at Home and Abroad, which uses Defense Manpower Data Center counts.
The growth during World War II is hard to picture. The National WWII Museum’s US military by the numbers shows 334,473 people in the Army, Navy and Marines in 1939 and 12,209,238 across all four services in 1945. It also says 61.2% of the men who served between 1941 and 1945 were drafted, and 407,316 were killed.
Why the veteran population is shrinking
The veteran population is shrinking because the huge wartime generations are dying and the all-volunteer military that replaced the draft in 1973 is much smaller. As the Census Bureau’s A Century of Serving shows, the number of veterans climbed after World War II, peaked around 1980 and has fallen ever since.
The share of men who have served tells the same story. In 1950, and again in 1980, 37% of American men aged 18 and over were veterans, according to the same Census Bureau infographic. By 2000 it was 25%, and in 2025 it was 11%. About 1% of adult women have been veterans in each year shown since 1980, which was the first census to ask women about veteran status.
The age profile shows where this goes next. In 2025, 30.5% of veterans were 75 or older and 8.4% were under 35, by the Census Bureau’s figures. The VA’s VetPop2023 projections have the total falling to about 16.0 million by 2030 and 11.2 million by 2053.
Which wars today’s veterans served in
Most living veterans served during the Vietnam War or later, and Post-9/11 veterans are now the largest group. These are the Census Bureau’s 2025 shares by period of service.
- Post-9/11 (September 2001 to now), 31.4%
- Vietnam War, 30.9%
- Persian Gulf War, 25.6%
- Korean War, 2.3%
- World War II, 0.3%
A year earlier, the Census Bureau’s 2024 figures still had Vietnam-era veterans ahead, on 31.3% against 29.9% for Post-9/11. World War II veterans were 0.4% in 2024 and 0.3% in 2025. If you want to know how quickly that last group is going, see how many WW2 veterans are still alive.
Where US veterans and service members live
Texas has the most veterans, followed by California and Florida. The VA’s VetPop2023 state table estimated 1,538,000 veterans in Texas in 2023, 1,475,000 in California and 1,413,000 in Florida. North Carolina, Pennsylvania and Virginia came next, each with just under 690,000.
Active-duty troops are even more concentrated. The Census Bureau’s U.S. Armed Forces at Home and Abroad shows 43% of all active-duty service members stationed in just five states, California, Texas, Virginia, North Carolina and Florida. Another 177,400, or 13%, serve overseas. The biggest groups abroad are in the Pacific and East Asia (86,000), Europe (66,400) and the Middle East (56,900), although the regional counts include US Central Command figures that aren’t in the overseas total.
The same graphic gives a picture of who serves today. The median active-duty service member is 28, 53% are married and about 1 in 6 are women.
Questions about US veterans and the military
What percentage of the US population are veterans?
5.9% of the civilian population aged 18 and over in 2025, according to the Census Bureau. That is down from about 7% in 2018 and 6.1% in 2023.
When was the US military at its largest?
In 1945, at the end of World War II. The Census Bureau puts the armed forces at 12.1 million that year, and the National WWII Museum’s table gives 12,209,238.
How many people are in the US military now?
About 1,325,000 people were on active duty in 2026, according to the Census Bureau’s Armed Forces at Home and Abroad graphic, which uses Defense Manpower Data Center figures. That doesn’t include the reserves or the National Guard.
Which state has the most veterans?
Texas, with about 1.54 million veterans in 2023 by the VA’s estimate. California and Florida each have more than 1.4 million.
When did the US end the draft?
In 1973, when the US moved to an all-volunteer force. Since then everyone who has joined the armed forces has volunteered.
How many female veterans are there in the US?
About 1.7 million in 2024, or 11.1% of all veterans, according to the Census Bureau.
Sources
- U.S. Census Bureau, A Century of Serving, size of the U.S. armed forces and number of veterans since 1915 (10 November 2026)
- U.S. Census Bureau, U.S. Armed Forces at Home and Abroad (10 November 2026)
- U.S. Census Bureau, Veterans Day 2026, November 11, from the 2025 American Community Survey
- U.S. Census Bureau, Veterans Day 2025 and Veterans Day 2024
- Jonathan Vespa, U.S. Census Bureau, Those Who Served, America’s Veterans From World War II to the War on Terror (ACS-43, 2020)
- U.S. Department of Veterans Affairs, Veteran Population, VetPop2023, national and state projection tables and VetPop2023, a brief description
- The National WWII Museum, Research Starters, US Military by the Numbers