Which countries lead semiconductor production?
No single country makes chips from start to finish. Semiconductor production has three stages, and each is led by a different place. In 2021 the United States held 61% of chip design by value, Taiwan held 47% of fabrication (the factories that actually make chips) and assembly, testing and packaging was split almost evenly between Taiwan (29%), the US (28%) and others (29%), with China on 14% [1]. “Others” here is mainly South Korea and Japan.
Trendline’s chart above, drawn from CSET data processed by Our World in Data, sums it up in its own headline: the US leads the world in chip design but lags behind in fabrication and assembly [1].
The three stages of semiconductor production
The Center for Security and Emerging Technology (CSET) at Georgetown University splits production into the same three segments [2]:
- Design. Engineers work out the logic and physical layout of a chip and validate it before anything is built.
- Fabrication (manufacturing). Factories called fabs turn the design into wafers, thin discs of silicon each holding many chips in a grid.
- Assembly, testing and packaging (ATP). The wafer is cut into individual chips, which are mounted on a frame, wired so they can connect to other devices, sealed in a protective case and tested [1].
CSET describes design and fabrication as the highest value and most technically complex stages, while ATP is labour intensive and has the lowest barriers to entry [2]. All three depend on other parts of the supply chain that sit outside these shares: manufacturing equipment, materials such as silicon wafers, chip design software and licensed designs [2].
Semiconductor market share by country and stage
| Stage (2021, share by value) | United States | Taiwan | China | Others |
|---|---|---|---|---|
| Design | 61% | 9% | 9% | 21% |
| Fabrication | 27% | 47% | 12% | 14% |
| Assembly, testing and packaging | 28% | 29% | 14% | 29% |
Source: CSET (2022), processed by Our World in Data, as charted by Trendline [1]. Others is mainly South Korea and Japan.
Why the US leads chip design
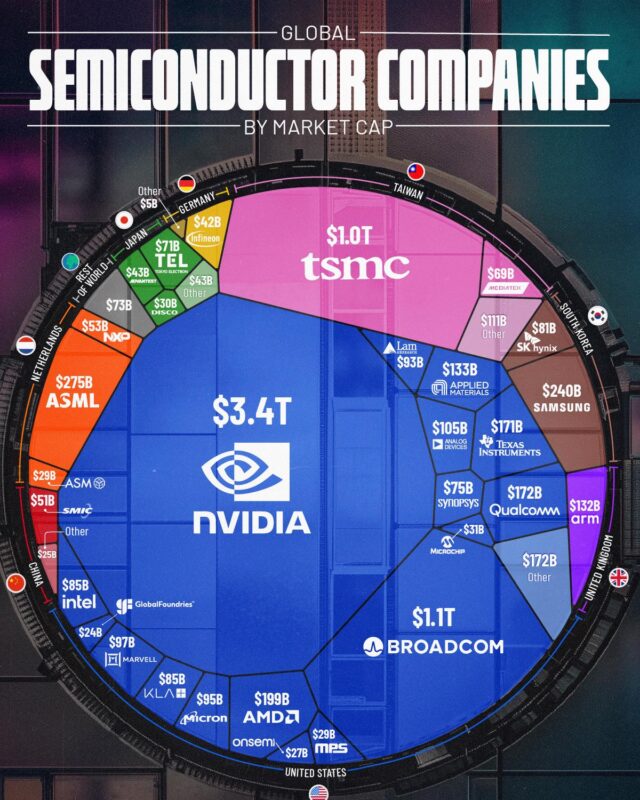
The US is home to most of the world’s biggest chip designers. Trendline credits companies such as Nvidia, AMD and Intel for the US lead in design, with most other design firms in East Asia: Taiwan, China and South Korea [1]. CSET adds that the US dominates research and development and has strong capabilities in every segment [2]. Companies such as Nvidia and AMD are “fabless”: they design chips and have other firms manufacture them, which helps explain why the US share of design is so much higher than its share of fabrication.
Why Taiwan leads chip manufacturing
Taiwan holds nearly half of global fabrication by value [1]. The best known Taiwanese maker is Taiwan Semiconductor Manufacturing Company (TSMC), which Trendline calls the largest and most well known Taiwanese chip maker [1]. CSET describes Taiwan as dominant in the most advanced manufacturing and in ATP [2]. That concentration is why chip supply is treated as a security issue: Trendline points out that any conflict in East Asia could threaten the supply lines that companies such as Nvidia and AMD rely on to get their chips made [1].
The US, by contrast, lacks the most advanced chip factories, especially foundries that manufacture chips for other companies, according to CSET [2]. It still had 27% of fabrication value in 2021 [1].
China, South Korea, Japan and Europe
CSET’s assessment of the other big players [2]:
- China is strongest in ATP, tools for assembly and packaging, and raw materials, and is progressing in design and manufacturing with state support. It struggles with manufacturing equipment, design software, core designs and some materials.
- South Korea works across all production steps and also produces significant amounts of materials and some equipment.
- Japan specialises in manufacturing equipment and materials and produces many older-technology chips.
- Europe, especially the Netherlands, the UK and Germany, specialises in manufacturing equipment (above all photolithography tools), materials and core designs.
Who controls the most value overall?
If you count the whole supply chain, including equipment and design tools, the picture shifts. CSET puts the US share of the total value of the global semiconductor supply chain at 39%, with Japan, Europe, Taiwan and South Korea together contributing another 53% and China 6% [2]. So while Taiwan makes most of the chips, it depends on American designs and software and on Dutch and Japanese machines to do so.
Packaging is also becoming more important. Trendline notes that assembly and packaging was historically a low value stage, but as transistor density has risen, packaging has become a driver of chip performance [1].
Questions about semiconductor production
Which country produces the most semiconductors?
Taiwan leads fabrication with 47% of global value in 2021, ahead of the US (27%) and China (12%) [1].
What are the stages of semiconductor manufacturing?
Design, fabrication in factories called fabs, and assembly, testing and packaging, where wafers are cut into chips, mounted, wired and cased [1][2].
Does the US make semiconductors?
Yes. The US had 27% of fabrication and 28% of assembly, testing and packaging by value in 2021, and 61% of design [1].
What share of the semiconductor supply chain does China have?
About 6% of the total value of the global supply chain, according to CSET, though it held 12% of fabrication and 14% of ATP in 2021 [1][2].
Sources
- Trendline (trendlineHQ.com), US leads in chip design but lags in manufacturing, 30 March 2024, the creator’s post of this chart (data from CSET 2022, processed by Our World in Data).
- Saif M. Khan, Center for Security and Emerging Technology, The Semiconductor Supply Chain: Assessing National Competitiveness, January 2021.
Last reviewed 2 November 2026