How many married couples are there in the US?
The US Census Bureau counted 62.8 million married-couple households in 2025, out of 134.8 million households in total [2]. That is 46.6% of all households (our calculation from the Census counts), which the Census rounds to 47% [3].
The count covers households where the householder (the person who owns or rents the home) lives with their husband or wife. It is slightly lower than the total number of married couples, because a couple living in someone else’s home, for example with parents, is counted as a subfamily rather than as its own household [4]. Since 2019 the Census figures for married people include same-sex married couples [5].
The number of married-couple households has grown slowly for decades. It was 34.1 million in 1950, 52.3 million in 1990 and 62.2 million in 2023 [2]. What has changed is everything around it: the total number of households roughly tripled over the same period, so married couples make up a much smaller share of homes than they used to.
What percentage of US households are married couples?
Just under half. Married couples headed 78.2% of US households in 1950, and the share has fallen in almost every decade since, as the Econovis chart by Ehsan Soltani above shows [1][2]. It slipped below half around 2010 and was 46.6% in 2025.
| Year | All households | Married-couple households | Married-couple share |
|---|---|---|---|
| 1950 | 43.6 million | 34.1 million | 78.2% |
| 1960 | 52.8 million | 39.3 million | 74.3% |
| 1970 | 63.4 million | 44.7 million | 70.5% |
| 1980 | 80.8 million | 49.1 million | 60.8% |
| 1990 | 93.3 million | 52.3 million | 56.0% |
| 2000 | 104.7 million | 55.3 million | 52.8% |
| 2010 | 117.5 million | 58.4 million | 49.7% |
| 2020 | 128.5 million | 62.3 million | 48.5% |
| 2023 | 131.4 million | 62.2 million | 47.3% |
| 2025 | 134.8 million | 62.8 million | 46.6% |
Source: US Census Bureau, Table HH-1, Households by Type [2]. Shares are our calculation from the Census counts. The 1980 row uses the Census revised figure.
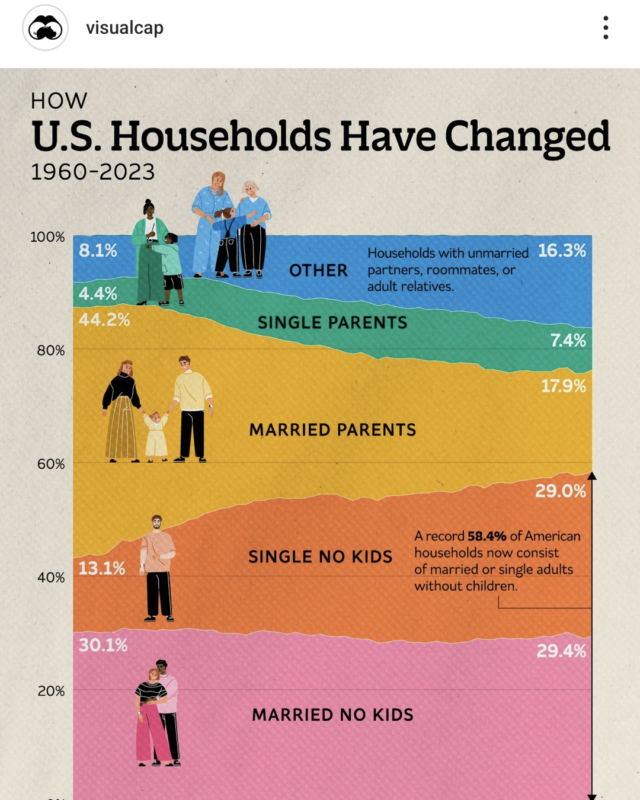
The biggest drop came in the 1970s, when the share fell about 10 points in a decade. Since 2010 the decline has been much slower, about 3 points in 15 years. The Census puts it in a 50-year frame: 66% of households were married couples in 1975, against 47% in 2025 [3].
What percentage of Americans are married?
About half of adults. In 2025 the Census estimated that 140.2 million people aged 15 and over were married, 50.4% of that age group (our calculation, which includes people who are separated or whose spouse lives elsewhere) [5]. In 1950 the same measure was 66.6% [5].
Of the rest, about 34.8% had never married, 9.4% were divorced and 5.4% were widowed in 2025 (our calculation from the same table) [5]. The never-married share is pushed up by young people: the table starts at age 15, and people are marrying later than they used to.
The household figure and the person figure answer different questions. A household count asks what kind of homes there are, so a single person living alone counts as much as a family of five. That is why the share of households headed by a married couple (under half) is lower than the share of adults who are married (about half).
Why are fewer US households married couples?
The Census data point to a few changes happening together rather than one cause.
- More people live alone. There were 39.7 million one-person households in 2025, 29% of all households, up from 20% in 1975 [3]. Nonfamily households, mostly people living alone or with people they are not related to, rose from 10.8% of households in 1950 to 36.2% in 2025 (our calculation) [2].
- People marry later. The median age at first marriage was 30.8 for men and 28.4 for women in 2025, up from 23.5 and 21.1 in 1975 [3]. Later marriage means more years living as a single adult, with flatmates or with a partner.
- The population is older. More than 1 in 4 householders were 65 or older in 2025, against 1 in 5 in 1975 [3]. Older households include many widowed people living alone.
- More families without a married couple. Family households headed by a single parent or another relative grew from 10.9% of households in 1950 to 17.1% in 2025 (our calculation) [2].
Married couples have also become less likely to have children at home. In 1975, 54% of married-couple households included their own children under 18; by 2025 it was about 37% [3].
What counts as a married-couple household?
The Census Bureau groups every household by the relationship of the people in it to the householder [4].
- A family household has at least one person related to the householder by birth, marriage or adoption. It is a married-couple household if the householder’s spouse lives there, and an “other family” household if not, for example a single parent with children.
- A nonfamily household is a person living alone, or a householder sharing only with people they are not related to, such as flatmates or an unmarried partner [4].
An unmarried couple living together is therefore not a married-couple household, even if they have children. The figures here come from the Current Population Survey’s Annual Social and Economic Supplement, a large survey rather than a full census, so each estimate has a margin of error [3].
Questions about married couples in the US
How many married couples are in the US in 2025?
The Census counted 62.8 million married-couple households in 2025 [2]. The full number of married couples is a little higher, because couples living in someone else’s household are counted separately as subfamilies [4].
When did married couples drop below half of US households?
Around 2010. The Census figures give a married-couple share of 50.0% in 2008, 50.5% in 2009 and 49.7% in 2010, and it has stayed below half since [2].
Is the number of married couples going down?
Not in absolute terms. The number of married-couple households has risen from 34.1 million in 1950 to 62.8 million in 2025 [2]. It is the share that has fallen, because the number of other kinds of household, especially people living alone, has grown much faster.
What share of US households are people living alone?
About 29%. There were 39.7 million one-person households in 2025, up from 20% of households in 1975 [3].
What is the average age of first marriage in the US?
The Census estimated the median age at first marriage in 2025 at 30.8 for men and 28.4 for women [3].
Sources
- Ehsan Soltani, Econovis, The Modern Family, Married Household Share Slip to 47% in the U.S. The creator’s original post of this chart.
- US Census Bureau, Table HH-1, Households by Type, 1940 to Present (Current Population Survey, released December 2025), from Historical Households Tables.
- US Census Bureau, Census Bureau Releases New Estimates on America’s Families and Living Arrangements, 2 December 2025.
- US Census Bureau, Current Population Survey subject definitions.
- US Census Bureau, Table MS-1, Marital Status of the Population 15 Years Old and Over, 1950 to Present (released December 2025).
Last reviewed 4 November 2026