

Finance and Economy
Digitally Delivered Services Exports Reached $4.3 Trillion
Exports grew from about $1.0 trillion to $4.3 trillion, an average of 8.2% a year.

Infographic publisher
Econovis is an economic research and data visualisation studio that turns macroeconomic, financial and business data into clear charts. Its blog covers the global money supply, world and US trade, energy and oil, markets and the US economy, and it also produces research, social media content and company reports for businesses, analysts and journalists. Here you will find its charts on trade, energy and money supply.
Exports grew from about $1.0 trillion to $4.3 trillion, an average of 8.2% a year.

Since the 2018 trade war the deficit with China has fallen from $402 billion to $287 billion a year, while the deficit with other countries nearly doubled…
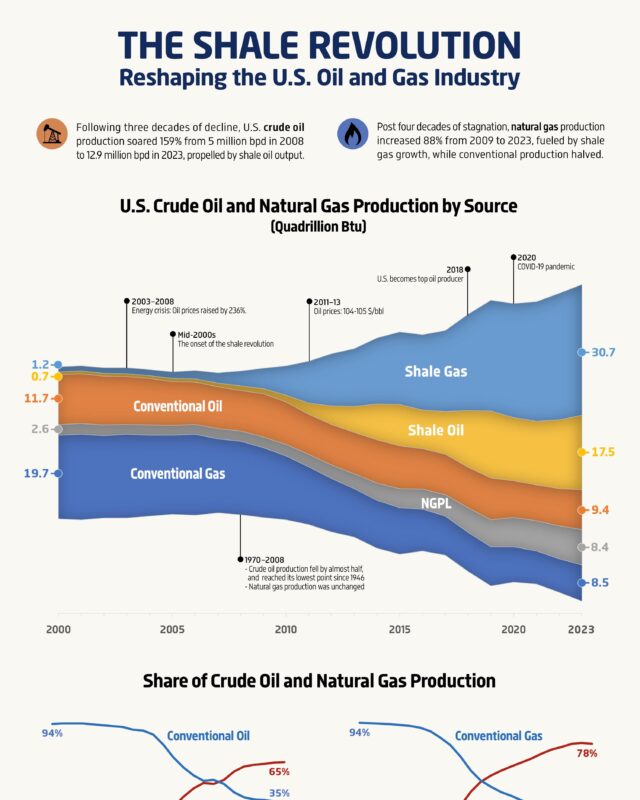
Crude oil output rose 159% from 5 million barrels a day in 2008 to 12.9 million in 2023, and natural gas output rose 88% from 2009.

The United States led at 12,927 thousand barrels per day, and Texas alone, at 5,512, out-produced every country except Russia and Saudi Arabia.

The world produced 82,757 thousand barrels per day.

Nationally a year of income covers 20% of a home, about five years of income.

In the 12 months to November 2024 the US exported 4.17 million barrels a day and imported 6.58 million, a deficit of 2.40 million.

Between December 2021 and December 2024, China's M2 grew 15.1% while the US figure was almost unchanged at 0.1%.

Imports grew from about 1.4 million to 11.1 million barrels a day, and Russia became the largest supplier at 2.19 million barrels a day, ahead of Saudi…

In the 12 months to November 2024 the EU exported €529 billion to the United States and imported €336 billion, a €193 billion surplus.

It supplied about 72% of real GDP growth from 1990 to 2024 and added to growth in 33 of those 35 years.

China bought 4,057 million barrels of crude that year, about 11.1 million barrels a day.
Is this your work? Tell us about a credit, a correction or a better description, and we will update this page.
Give it a permanent page where people looking for your subject find it, with your name and a link to your site. Content marketers, agencies, designers and researchers all list here.