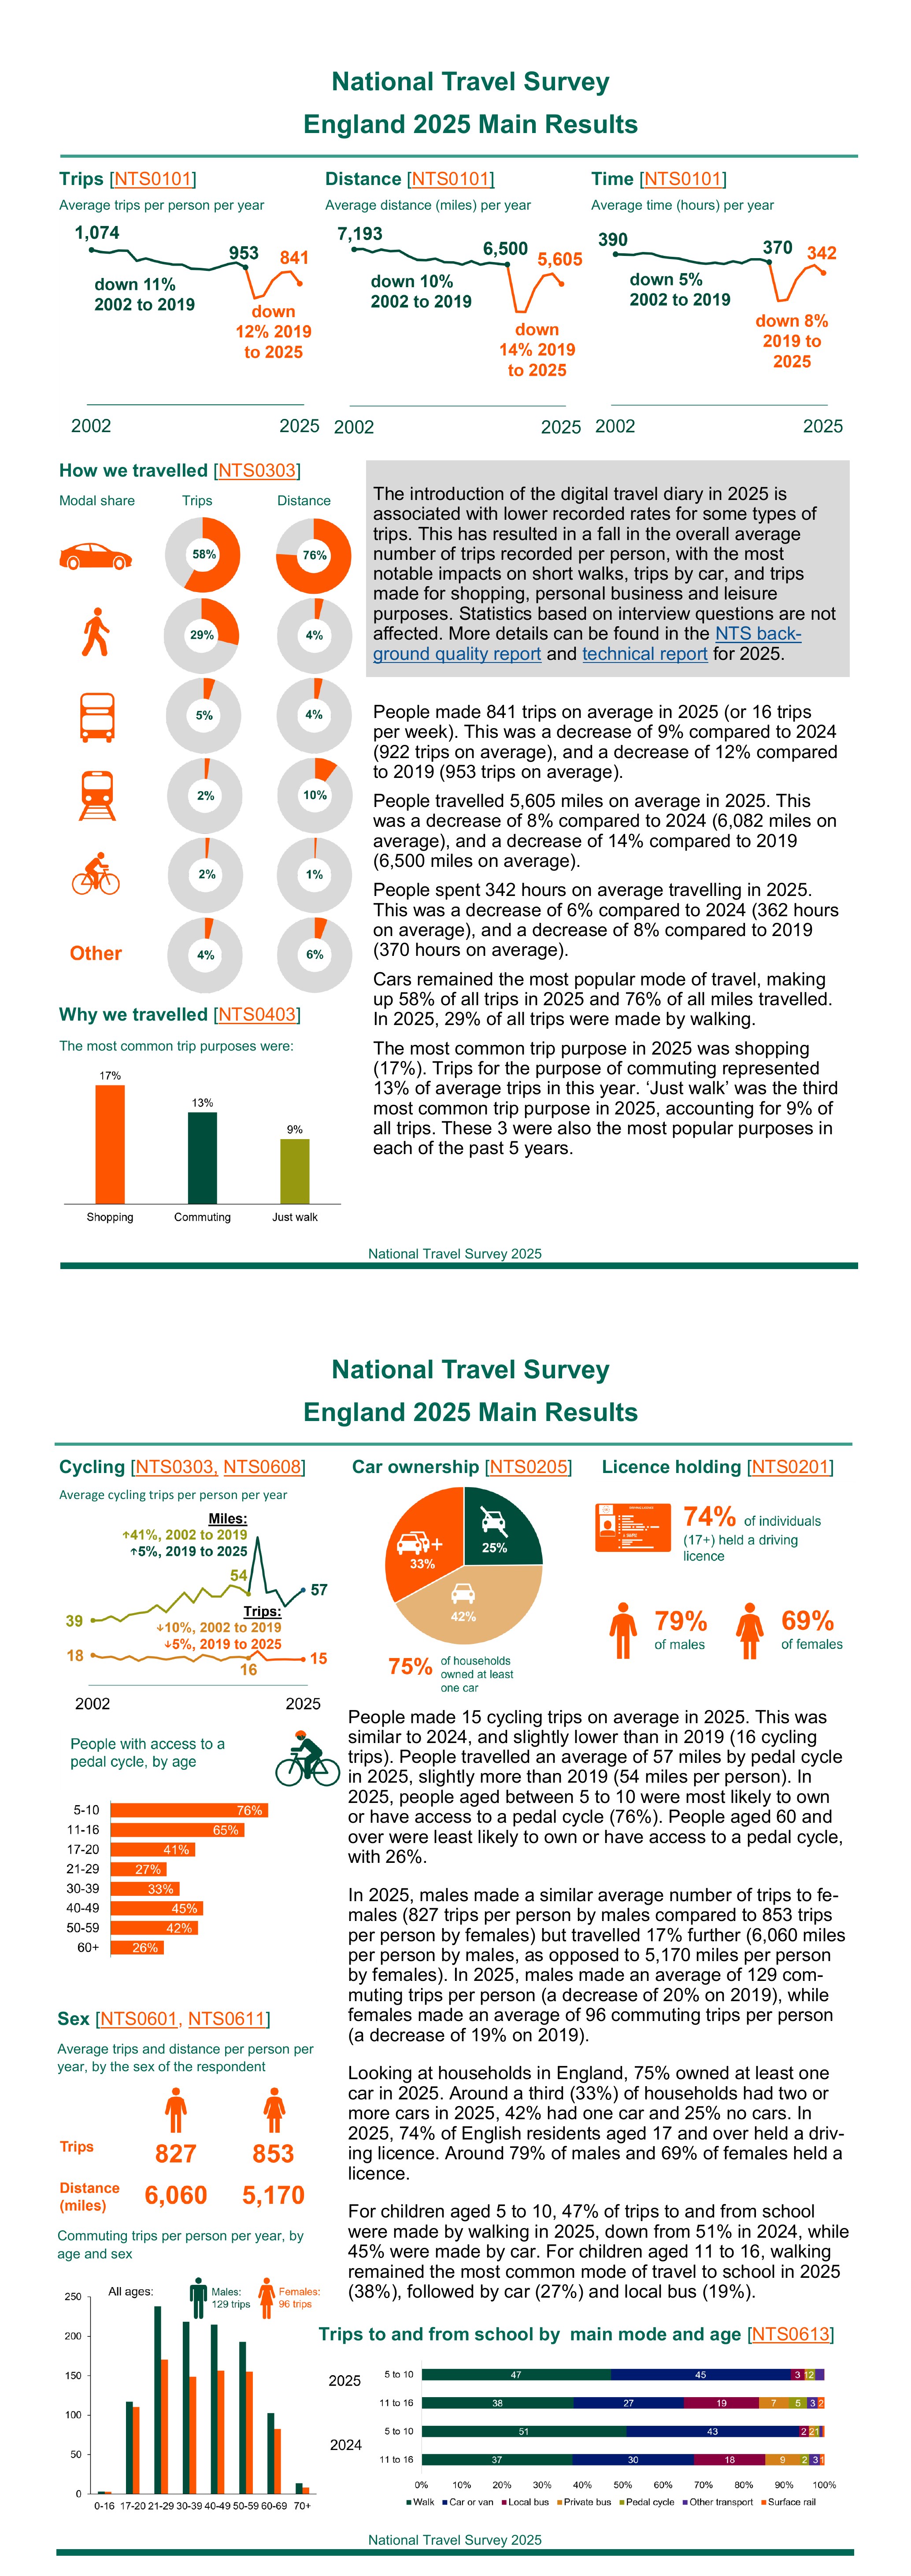
The National Travel Survey is the Department for Transport’s yearly survey of how people in England travel. Its 2025 results show the average person made 841 trips, covered 5,605 miles and spent 342 hours travelling in the year. Cars accounted for 58% of trips and 76% of miles, walking made up 29% of trips, and three in four households had at least one car.
What is the National Travel Survey?
The National Travel Survey (NTS) is a household survey of personal travel by people living in England, run by the Department for Transport (DfT). Everyone in a selected household is interviewed and then keeps a seven-day travel diary, which is how the survey can count trips, miles and time spent travelling.
The survey has run continuously since 1988, following one-off surveys from the 1960s, according to DfT’s NTS 2025 introduction and main findings. The 2025 results were published on 10 September 2026. In 2025, 20,190 people took part fully and the final response rate was 28%. The figures are Accredited Official Statistics, which means the Office for Statistics Regulation has reviewed them against the Code of Practice for Statistics.
The infographic above is DfT’s two-page factsheet of the main 2025 results. It is a quick way to see the headline numbers, and the sections below explain what they mean and add the detail from the full release.
How much people in England travel each year
The average person in England made 841 trips in 2025, about 16 a week, travelled 5,605 miles and spent 342 hours on the move, DfT reports. All three measures were lower than in 2024 and below their 2019 levels.
| Measure (per person per year) | 2019 | 2024 | 2025 |
|---|---|---|---|
| Trips | 953 | 922 | 841 |
| Miles travelled | 6,500 | 6,082 | 5,605 |
| Hours spent travelling | 370 | 362 | 342 |
These figures are from DfT’s NTS 2025 main findings. The average cycling trip took 25 minutes in 2025, the average car driver trip 22 minutes and the average walk 19 minutes.
The long-term pattern matters as much as the latest year. From the early 1970s to the early 2000s people travelled further each year while making about the same number of trips. Average distance then drifted down, trips and hours held steady until 2019, and all three fell sharply in 2020 during the pandemic before recovering part of the way.
Why the 2025 travel figures fell
Much of the fall between 2024 and 2025 is down to a change in how the survey collects data rather than a real drop in travel. In January 2025 DfT moved the travel diary from paper to a digital diary, which 74% of households used, and the digital diary appears to record fewer of some types of trip.
DfT says the biggest effects are on walks of less than a mile and on car driver and car passenger trips, and on trips for shopping, personal business and leisure. Commuting and education trips show no apparent fall in recording, and trip lengths and durations look unaffected. Its car trips chapter points out that DfT’s road traffic statistics show a 2% rise in car and taxi traffic between 2024 and 2025, the opposite of the NTS fall. Figures from the interview, such as car ownership and personal characteristics, are not affected.
So the 2025 trip counts are best compared with earlier years carefully. Shares of trips by mode and purpose, and interview-based figures, are the safer numbers to quote.
What is the most used transport in England?
The car is by far the most used form of transport in England. Car trips, as driver or passenger, made up 58% of all trips and 76% of all miles travelled in 2025, according to DfT’s NTS 2025 factsheet. Walking was second for trips but covers little distance, while rail carries few trips but a large share of miles.
| Main mode | Share of trips | Share of distance |
|---|---|---|
| Car or van | 58% | 76% |
| Walking | 29% | 4% |
| Local bus | 5% | 4% |
| Surface rail | 2% | 10% |
| Pedal cycle | 2% | 1% |
| Other | 4% | 6% |
Most trips are short. DfT’s mode share chapter shows 24% of trips were under a mile and 70% were under five miles in 2025. Walking accounted for 82% of trips under a mile, and for anything longer the car was the most common choice. 82% of people used a car at least once a week, and only 7% used one less than once a year or never.
Grouped together, 31% of trips were active travel such as walking and cycling, 59% were by private transport and 10% by public transport. London stands out, with 35% of trips by active modes and 31% by public transport, while the West Midlands had the highest private transport share at 65%.
Why people travel
Shopping is the most common reason people travel, followed by commuting and walking for its own sake. DfT’s trips by purpose chapter records 145 shopping trips per person in 2025 (17% of trips), 112 commuting trips (13%) and 79 trips that were just a walk (9%).
- Commuting was 20% below its 2019 level, which DfT says may reflect the shift to working from home and hybrid working. It is still the purpose with the longest total distance, at 1,031 miles per person a year.
- Visiting friends at their homes accounted for 804 miles per person, the second largest distance.
- Just walk trips were 31% higher than in 2019, one of the clearest lasting changes since the pandemic.
- Shopping rises with age, and people aged 70 and over made around 250 shopping trips each.
Public transport use in England
Public transport accounted for 10% of trips and 17% of distance travelled in 2025, according to DfT’s public transport chapter. Buses carry the most public transport trips, while rail covers the longest distances.
- Buses outside London averaged 28 trips per person, unchanged from 2024 but down from 46 in 2002.
- Buses in London averaged 15 trips per person, up 12% on 2024.
- The London Underground averaged 11 trips per person, up 15%.
- Surface rail averaged 18 trips and 567 miles per person, down 11% on 2024. DfT notes that rail passenger statistics show journeys rising over a similar period and that NTS rail figures are more volatile because few people use rail.
Just over half (52%) of public transport trips used more than one mode, and 63% of those started with a walk.
Car ownership and driving licences
Three in four households in England had at least one car in 2025, and one in three had two or more. DfT’s car availability chapter puts the split at 25% with no car, 42% with one car and 33% with two or more.
That is a big change over 50 years. In 1971, 48% of households had no car and only 8% had two or more. There are now 12 cars for every 10 households in England, compared with 8 for every 10 households in Great Britain in 1985 to 1986.
Income makes a large difference. 44% of households in the lowest income fifth had no car, against 17% in the highest, and 43% of the highest income households had two or more cars.
Of the cars people owned in 2025, 57% ran on petrol, 28% on diesel, 8% were hybrids, 5% were battery electric and 2% were plug-in hybrids. 59% had a manual gearbox. The factsheet shows 74% of people aged 17 and over held a full car driving licence, 79% of men and 69% of women.
Walking and cycling in England
Walking makes up nearly a third of trips but cycling only 2%. DfT’s active travel chapter records 243 walking trips and 215 miles walked per person in 2025, and 15 cycling trips covering 57 miles.
Longer walks are growing. People made 79 walks of a mile or more in 2025, 21% more than in 2019, and walked 125 miles on them, up 25%. The most common reason for a walk was simply to go for a walk (33% of walking trips), followed by education or the school run (20%) and shopping (16%). Walking also had the highest satisfaction of any mode, with around 70% of people satisfied with provision.
Cycling miles rose 8% on 2024 and were 5% above 2019. Leisure was the top reason to cycle (35% of cycling trips), followed by commuting (32%). Men made 22 cycling trips and rode 83 miles on average, against 9 trips and 30 miles for women. Owning or having access to a bike falls with age, from 76% of children aged 5 to 10 to 26% of people aged 60 and over.
How men and women travel differently
Women make slightly more trips than men, but men travel further. In 2025 men made 827 trips and travelled 6,060 miles on average, while women made 853 trips and travelled 5,170 miles, so men covered 17% more distance, DfT’s trips by sex chapter shows.
The gap comes from the kind of trips each makes. Women made more car trips (495 against 485) but men went further by car, 4,640 miles per person as a driver or passenger against 3,885 for women. Women made more shopping trips, which tend to be short, while men made more commuting and business trips, which tend to be long. Men averaged 129 commuting trips a year and women 96, both around a fifth lower than in 2019.
How children travel to school
Walking is the most common way to get to and from school, used for 42% of school trips by children aged 5 to 16 in 2025. DfT’s school travel chapter shows the car close behind for younger children.
- Aged 5 to 10, 47% of school trips were walked, 45% were by car, 3% by local bus and 2% by bike. 79% of school trips under a mile were walked.
- Aged 11 to 16, 38% were walked, 27% by car, 19% by local bus and 5% by bike. For school trips of five miles or more, 59% were by bus.
Parents of children who did not usually walk said the main barrier was distance, given for 56% of boys and 55% of girls. Asked what would encourage more walking to school, 58% said nothing would, and safer roads were the most common answer from the rest of the list, chosen by 23%.
Questions about the National Travel Survey
What is the most used transport in the UK?
The car. In England, car trips as a driver or passenger made up 58% of all trips and 76% of all distance travelled in 2025, according to the National Travel Survey. Walking came second with 29% of trips.
How many trips does the average person make a year?
The average person in England made 841 trips in 2025, about 16 a week. DfT says part of the fall from 922 in 2024 is because the new digital travel diary records fewer short walks and car trips.
How many miles does the average person travel a year in England?
The average person travelled 5,605 miles in 2025 by all modes, and 76% of those miles were by car. Men travelled 6,060 miles on average and women 5,170 miles.
How many households in England have a car?
75% of households in England had at least one car in 2025. 42% had one car, 33% had two or more and 25% had none.
What are the travel statistics by age group?
Children aged 0 to 16 made the highest share of their trips by walking and cycling (37%). People aged 17 to 20 made the highest share by public transport (24%) and the lowest by private transport (46%). People aged 70 and over made the most shopping trips, around 250 a year.
Why did the National Travel Survey trips fall in 2025?
Mainly because of the switch from paper to digital travel diaries in 2025, which appears to record fewer walks under a mile, car trips and shopping and leisure trips. DfT advises care when comparing 2025 trip rates with earlier years.
Sources
- Department for Transport, National Travel Survey 2025 (published 10 September 2026)
- Department for Transport, NTS 2025 factsheet and factsheet PDF (the infographic)
- Department for Transport, NTS 2025 introduction and main findings
- Department for Transport, NTS 2025 mode share and multi-modal trips
- Department for Transport, NTS 2025 trends in public transport trips
- Department for Transport, NTS 2025 household car availability and trends in car trips
- Department for Transport, NTS 2025 active travel
- Department for Transport, NTS 2025 trips by purpose, age, mode and sex
- Department for Transport, NTS 2025 travel to and from school
- Department for Transport, NTS 2025 quality report
Contains public sector information published by the Department for Transport and licensed under the Open Government Licence v3.0. Its use here does not imply any endorsement by the Department for Transport.