Which country has the highest median wealth?
Luxembourg has the highest median wealth by country, at about $394,000 per adult in the UBS Global Wealth Report 2026, followed by Belgium ($277,000) and Australia ($211,000). Switzerland has the highest average wealth, at about $910,000 per adult, but is only eighth for median wealth. The United States is second for average wealth and 28th for median wealth [1].
The infographic by Visual Capitalist uses the earlier UBS Global Wealth Report 2024, with figures for 2023. Luxembourg was top for median wealth then as well, at $372,000, with Australia second at $262,000 and Belgium third at $256,000 [2]. The countries near the top change little from year to year, but the comparison with average wealth shows how far the typical adult in a country can be from its average.
Median wealth by country, the top 20
These are the latest UBS figures, for the end of 2025, in US dollars per adult. The last column is average wealth divided by median wealth (our arithmetic). The higher that number, the more a country’s wealth is held by people at the top [1].
| Median rank | Country | Median wealth per adult | Average wealth per adult | Average rank | Average as a multiple of median |
|---|---|---|---|---|---|
| 1 | Luxembourg | $394,005 | $654,732 | 3 | 1.7 |
| 2 | Belgium | $277,166 | $407,920 | 11 | 1.5 |
| 3 | Australia | $210,783 | $616,306 | 5 | 2.9 |
| 4 | New Zealand | $206,617 | $449,852 | 8 | 2.2 |
| 5 | Denmark | $203,771 | $523,344 | 7 | 2.6 |
| 6 | Hong Kong | $187,968 | $648,267 | 4 | 3.4 |
| 7 | Canada | $147,811 | $399,886 | 13 | 2.7 |
| 8 | Switzerland | $145,555 | $910,382 | 1 | 6.3 |
| 9 | Norway | $140,003 | $425,391 | 9 | 3.0 |
| 10 | Japan | $135,745 | $211,846 | 24 | 1.6 |
| 11 | Italy | $131,001 | $279,439 | 23 | 2.1 |
| 12 | Netherlands | $127,407 | $415,287 | 10 | 3.3 |
| 13 | United Kingdom | $125,335 | $292,808 | 21 | 2.3 |
| 14 | France | $121,898 | $341,359 | 15 | 2.8 |
| 15 | Malta | $114,033 | $163,655 | 28 | 1.4 |
| 16 | Taiwan | $113,137 | $332,533 | 16 | 2.9 |
| 17 | Spain | $111,575 | $306,412 | 20 | 2.7 |
| 18 | South Korea | $101,739 | $311,260 | 19 | 3.1 |
| 19 | Ireland | $98,413 | $314,167 | 17 | 3.2 |
| 20 | Singapore | $96,434 | $527,217 | 6 | 5.5 |
Further down the median list are Qatar ($95,499), Finland ($89,695), Sweden ($84,039) and Israel ($83,843). The United States is 28th at $68,998 and Germany 30th at $53,485, even though both are in the top 15 for average wealth [1].
Average wealth vs median wealth
Average (mean) wealth is a country’s total household wealth divided by its number of adults. Median wealth is the wealth of the adult exactly in the middle, so half of adults have more and half have less [1].
The two can be far apart because wealth is very unevenly spread. A few hundred billionaires add a lot to a country’s total, which lifts the average, but they make almost no difference to the person in the middle. UBS puts it this way. A small group of very wealthy people can boost a nation’s average and make its people look better off than they really are, while the median gives a better picture of wealth in the middle of the scale [1].
Neither number is the full story on its own. The median says nothing about what happens at the top, and the average says little about ordinary households. That is why the Visual Capitalist graphic puts the two rankings side by side. A country that does well on both, like Luxembourg, Australia or Denmark, has high wealth that is shared reasonably widely. A country that does much better on average than on median, like Switzerland, Singapore or the US, has high wealth that is concentrated at the top.
Why the US ranks so differently
The US is the clearest example of the gap. In the 2024 report used on the graphic, average wealth per adult was $565,000 (fourth in the world) and median wealth was $112,000 (14th), so the average was about five times the median [2]. In the 2026 report, average wealth is $696,277 (second) and median wealth is $68,998 (28th), a multiple of about ten (our arithmetic) [1].
The US also holds a very large share of the world’s wealth. UBS estimates it is home to 35.7% of the personal wealth in the 56 markets it covers [1].
US government data tells the same story in a different way. The Federal Reserve’s 2022 Survey of Consumer Finances put median family net worth at $192,900 and mean family net worth at $1,063,700, so the mean was about five and a half times the median [3]. Those figures are per family rather than per adult, which is why they are higher than the UBS per adult numbers.
How the rankings have changed
Luxembourg has been top for median wealth in each of the last three UBS reports, and Belgium and Australia have stayed in the top three. Other positions move more.
- In the 2024 report (2023 figures), Luxembourg was first at $372,000, Australia second at $262,000 and Belgium third at $256,000. Switzerland was seventh at $171,000, the UK eighth at $164,000 and the US 14th at $112,000 [2].
- In the 2025 report (2024 figures), Luxembourg was first at $395,000, ahead of Australia ($268,000) and Belgium ($254,000). Switzerland was fourth at $222,000 and the US 15th at $124,000 [4].
- In the 2026 report (2025 figures), Belgium moved up to second, Switzerland fell to eighth, the UK was 13th and the US dropped to 28th [1].
Be careful comparing editions. UBS updated some of its methods for the 2026 report and says comparisons with previous reports are not always possible [1]. Exchange rates also matter. All figures are in US dollars at end of year rates, and the dollar fell against most major currencies in 2025, which makes wealth outside the US look stronger in dollar terms [1]. UBS also found that while average wealth rose in 2025, median wealth fell in most markets [1].
What counts as wealth in these figures
UBS defines wealth (net worth) as the value of financial assets and real assets, mainly housing, owned by private individuals, minus their debts. Private pension funds are included, but state pension entitlements are not unless they are fully funded. Skills and earning power are left out, as are assets and debts owned by the state [1].
The figures are not adjusted for living costs. $150,000 of wealth goes a lot further in Portugal than in Switzerland or Hong Kong, so a high median in dollar terms doesn’t always mean people are better off day to day [1].
Questions about median wealth by country
What is median wealth?
Median wealth is the middle value when every adult’s net worth is arranged from lowest to highest. Half of adults have more and half have less. It is less affected by very large fortunes than average wealth [1].
Which country has the highest median wealth per adult?
Luxembourg, at $394,005 per adult in the UBS Global Wealth Report 2026. Belgium is second at $277,166 and Australia third at $210,783 [1].
What is the median wealth per adult in the US?
UBS puts US median wealth at $68,998 per adult at the end of 2025, 28th among the markets it ranks, against average wealth of $696,277 [1]. The earlier 2024 report used on the graphic gave $112,000 [2]. Per family, the Federal Reserve’s 2022 survey gave median net worth of $192,900 [3].
Which country has the highest average wealth?
Switzerland, with average wealth of $910,382 per adult, followed by the United States ($696,277) and Luxembourg ($654,732) [1].
What is the median wealth of the world?
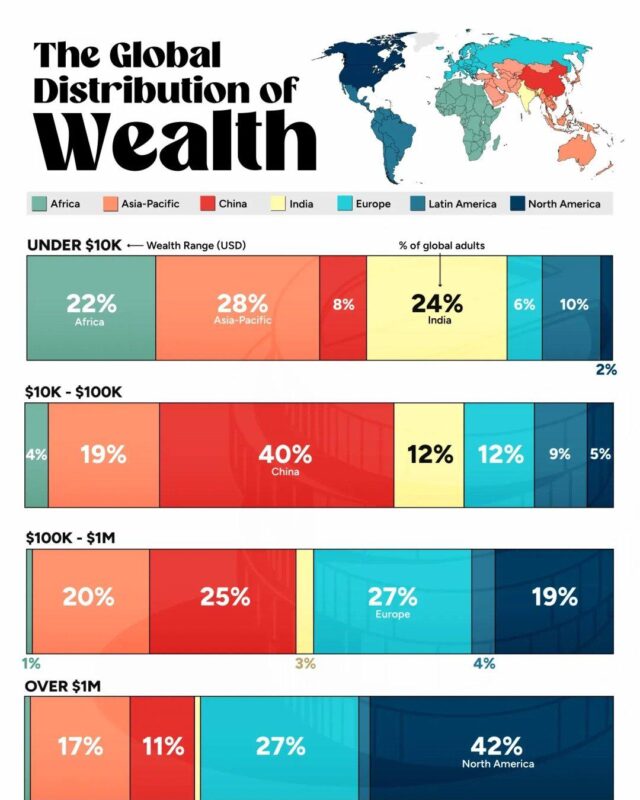
The last full UBS country dataset, for the end of 2022, put world median wealth at $8,654 per adult and world average wealth at $84,718, so the average was almost ten times the median [5]. In the same data, just over half of the world’s adults (52.5%) had less than $10,000 [5].
Is median or average wealth a better measure?
Median wealth is better for knowing what a typical adult owns. Average wealth is better for knowing how much wealth a country has in total per person. Looking at both together, as the infographic does, shows how evenly that wealth is shared [1].
Sources
- UBS, Global Wealth Report 2026, June 2026 (end of 2025 figures, wealth per adult top 30 tables and notes on methods).
- Marcus Lu, Visual Capitalist, Ranked: Top 20 Countries by Average vs. Median Wealth, December 2024 (UBS Global Wealth Report 2024, 2023 figures). This is the original post for the infographic.
- Federal Reserve Board, Changes in U.S. Family Finances from 2019 to 2022, Evidence from the Survey of Consumer Finances, October 2023.
- Voronoi, Top Countries by Average and Median Wealth per Person, August 2025 (UBS Global Wealth Report 2025).
- Wikipedia, List of countries by wealth per adult (UBS Global Wealth Report 2026 and Global Wealth Databook 2023).
Last reviewed 10 November 2026