How big were the winning margins in US presidential elections?
A US presidential election analysis of the last hundred years shows the winning margins have shrunk. Franklin Roosevelt won in 1936 by 24.3 points in the popular vote and 97 points in the Electoral College. Since 1988 no winner has topped 8.5 popular points, and Donald Trump won in 2024 by 1.5 points, or 312 electoral votes to 226.
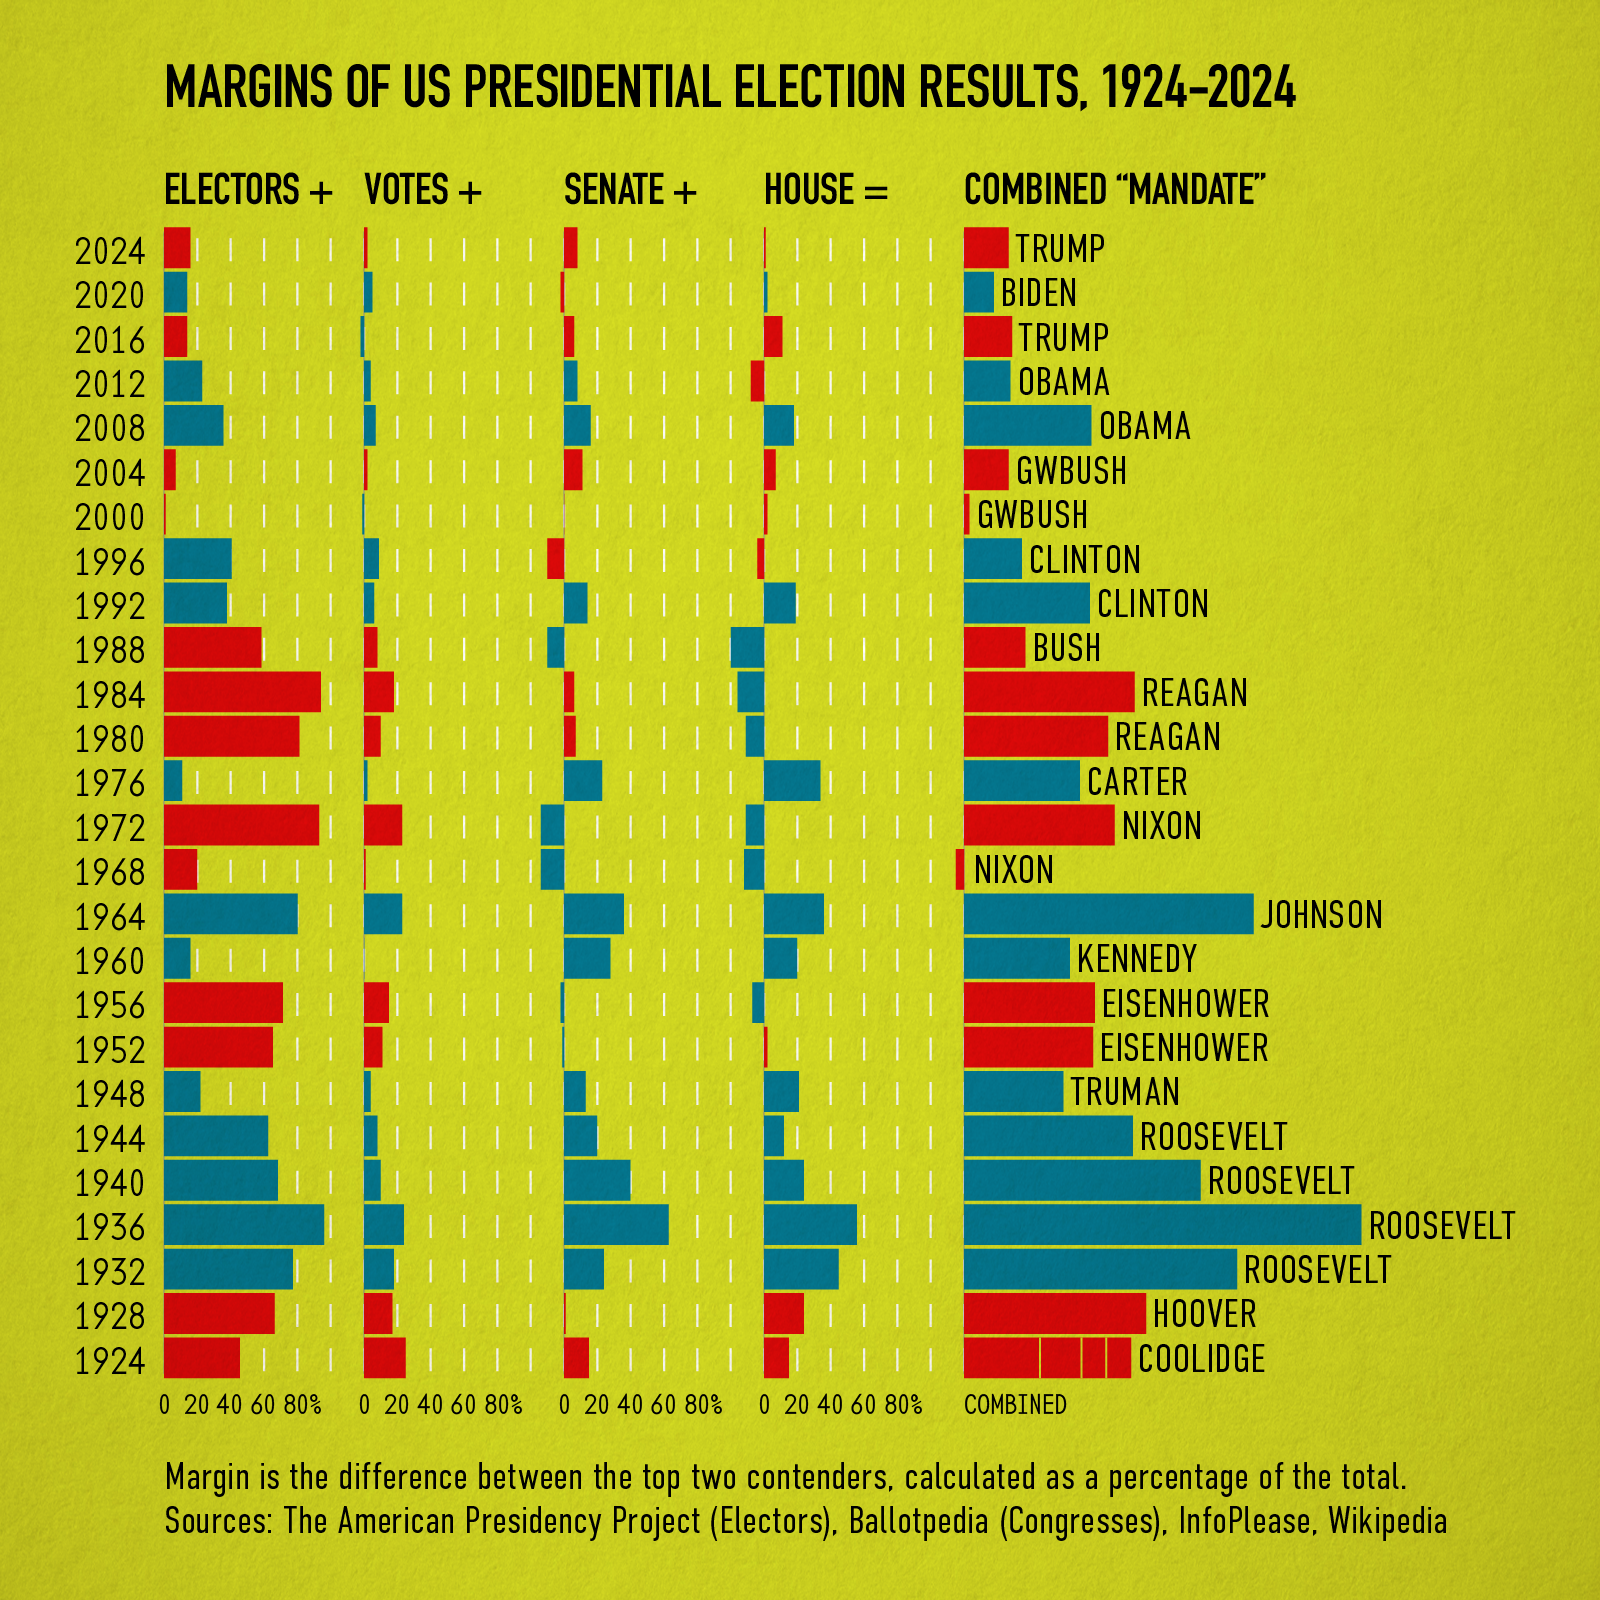
The infographic by ptrdo goes a step further and asks how strong each president’s mandate was. It adds the electoral vote margin, the popular vote margin and the party margins in the new Senate and House into one score [1]. This article uses the official margins from The American Presidency Project and the seat counts for each Congress to explain what those scores mean and why the big landslides have gone [2][3].
Popular vote and electoral vote margins since 1924
The Electoral College nearly always makes a win look bigger than the popular vote does. In 26 elections from 1924 to 2024, the winner’s electoral margin was larger than his popular vote margin every time, often by 20 to 40 points [2]. Both margins are the winner’s share minus his main opponent’s share.
| Election | Winner | Popular vote share | Popular vote margin (points) | Electoral vote margin (points) |
|---|---|---|---|---|
| 2024 | Donald Trump (R) | 49.8% | 1.5 | 16.0 |
| 2020 | Joe Biden (D) | 51.3% | 4.5 | 13.8 |
| 2016 | Donald Trump (R) | 46.2% | -2.0 | 14.3 |
| 2012 | Barack Obama (D) | 51.0% | 3.7 | 23.4 |
| 2008 | Barack Obama (D) | 52.9% | 7.2 | 35.6 |
| 2004 | George W. Bush (R) | 50.7% | 2.4 | 6.5 |
| 2000 | George W. Bush (R) | 47.9% | -0.5 | 1.0 |
| 1996 | Bill Clinton (D) | 49.2% | 8.5 | 40.8 |
| 1992 | Bill Clinton (D) | 43.0% | 5.6 | 37.6 |
| 1988 | George H. W. Bush (R) | 53.4% | 7.8 | 58.6 |
| 1984 | Ronald Reagan (R) | 58.8% | 18.2 | 95.2 |
| 1980 | Ronald Reagan (R) | 50.7% | 9.7 | 81.8 |
| 1976 | Jimmy Carter (D) | 50.1% | 2.1 | 10.6 |
| 1972 | Richard Nixon (R) | 60.7% | 23.2 | 93.5 |
| 1968 | Richard Nixon (R) | 43.4% | 0.7 | 20.4 |
| 1964 | Lyndon Johnson (D) | 61.1% | 22.6 | 80.6 |
| 1960 | John F. Kennedy (D) | 49.7% | 0.2 | 15.6 |
| 1956 | Dwight Eisenhower (R) | 57.4% | 15.4 | 72.4 |
| 1952 | Dwight Eisenhower (R) | 54.9% | 10.5 | 66.4 |
| 1948 | Harry Truman (D) | 49.5% | 4.4 | 21.5 |
| 1944 | Franklin Roosevelt (D) | 53.4% | 7.5 | 62.8 |
| 1940 | Franklin Roosevelt (D) | 54.7% | 9.9 | 69.2 |
| 1936 | Franklin Roosevelt (D) | 60.8% | 24.3 | 97.0 |
| 1932 | Franklin Roosevelt (D) | 57.4% | 17.8 | 77.8 |
| 1928 | Herbert Hoover (R) | 58.2% | 17.4 | 67.2 |
| 1924 | Calvin Coolidge (R) | 54.0% | 25.2 | 46.3 |
Source for every figure in the table is The American Presidency Project at the University of California, Santa Barbara [2]. A negative popular vote margin means the winner got fewer votes than the runner up.
The biggest landslides in US presidential elections
The largest wins of the last century were Roosevelt in 1936, Lyndon Johnson in 1964, Richard Nixon in 1972 and Ronald Reagan in 1984. Each took more than 58% of the popular vote and won the Electoral College by more than 80 points [2].
Roosevelt in 1936 lost only Maine and Vermont and won 98.5% of electoral votes, the highest share since 1820 [2]. Johnson in 1964 has the highest popular vote share of the period, 61.1%, and Coolidge in 1924 the widest popular vote margin, 25.2 points, because the opposition vote was split between the Democrat John Davis and the Progressive Robert La Follette [2]. Reagan in 1984 won 49 states and 97.6% of electoral votes [2].
The closest presidential elections
The closest elections by popular vote were 1960, 2000 and 1968. John F. Kennedy won the 1960 popular vote by 0.2 points, Nixon won in 1968 by 0.7 points while George Wallace carried five Southern states, and in 2000 George W. Bush lost the popular vote by 0.5 points and won the Electoral College by 271 votes to 266 [2].
Recent elections have all been close. From 2000 to 2024 the biggest popular vote margin was Barack Obama’s 7.2 points in 2008, and five of the seven were within 4 points either way [2]. Trump’s 2024 win, 77,302,580 votes to Kamala Harris’s 75,017,613 by the Federal Election Commission count, was the third narrowest popular vote win since 1924, after 1960 and 1968 [2][4]. It was still a clear Electoral College win, because he carried all seven swing states.
Presidents who won without the popular vote
Five presidents have won the Electoral College while losing the popular vote. They are John Quincy Adams in 1824, Rutherford Hayes in 1876, Benjamin Harrison in 1888, George W. Bush in 2000 and Donald Trump in 2016 [2]. In 1824 no one won an electoral majority and the House of Representatives chose Adams.
The 2016 result is the widest gap of the modern era. Trump got 2.0 points fewer votes than Hillary Clinton but won the Electoral College by 14.3 points, 304 to 227 [2]. The gap comes from the winner taking all of a state’s electors (except in Maine and Nebraska), so narrow wins in big states count for far more than large wins elsewhere.
Measuring a presidential mandate
There is no official measure of a mandate. The American Presidency Project uses the popular and electoral vote margins, and says the size of the president’s party in the House and Senate has to be weighed alongside them, because that decides whether he can pass laws [2]. The infographic by ptrdo builds that in. It adds the four margins together, and a chamber held by the other party counts against the president [1].
Working through that method with the official seat counts gives these scores (our arithmetic from [2] and [3]).
- Roosevelt, 1936, about 240. His Democrats held 76 of 96 Senate seats and 333 of 435 House seats.
- Johnson, 1964, about 175, with 68 Senate seats and 295 House seats.
- Reagan, 1984, about 103. His huge Electoral College win was trimmed by a Democratic House of 253 seats to 181.
- Trump, 2024, about 26. Republicans held the Senate 53 to 45 but the House only 219 to 215 when the new Congress met.
- Bush, 2000, about 3, with a 50 to 50 Senate and a House majority of nine.
- Nixon, 1968, about minus 7. Democrats kept the Senate 58 to 42 and the House 243 to 192, so he is the only winner in the period with a negative score.
As the graphic shows, scores were highest in the 1930s and 1960s, when one party could win the White House and big majorities in Congress together. Since 1996 only Obama in 2008 has come close to that. It is a home made measure, so treat the numbers as a way of comparing elections rather than as a statistic.
One bar looks wrong. The 1928 Senate bar is drawn at almost zero, but the Senate that sat with Herbert Hoover from 1929 had 56 Republicans and 39 Democrats, a margin of about 18 points [3]. It may be using the outgoing Senate. The other bars we checked match the seat counts.
Why winning margins have narrowed
Landslides have become rare because far fewer voters split their ticket or switch parties than in the 1970s and 1980s. In 2020 only 16 congressional districts voted for a president of one party and a House member of the other, against 83 in 2008, and after the 2024 elections just three states (Maine, Pennsylvania and Wisconsin) had senators from both parties, the fewest since senators were first directly elected [5]. With most states safe for one side, the election turns on a handful of swing states, and the winner’s party tends to come in with a thin majority in Congress or none at all.
Turnout is a separate question. Our page on presidential election results including non-voters looks at each election as a share of all eligible voters, where people who did not vote were the largest group in most years from 1976 to 2016.
Questions about US presidential election analysis
Which president won by the largest margin?
Franklin Roosevelt in 1936 had the largest Electoral College margin, 97 points, winning 523 electoral votes to 8. The widest popular vote margins since 1900 were Warren Harding’s 26.2 points in 1920 and Calvin Coolidge’s 25.2 points in 1924 [2].
What was the margin in the 2024 presidential election?
Donald Trump won the popular vote by 1.5 points, 49.8% to 48.3%, and the Electoral College by 312 votes to 226 [2][4].
What was the closest presidential election?
By popular vote, 1960 (0.2 points) and 1880 (0.1 points). By electoral votes, 2000, which Bush won 271 to 266, and 1876, which Hayes won by a single electoral vote [2].
How many presidents lost the popular vote but won?
Five. John Quincy Adams, Rutherford Hayes, Benjamin Harrison, George W. Bush and Donald Trump in 2016 [2].
What is a presidential mandate?
It is the idea that a big win gives the president public backing for his plans. There is no fixed threshold. Historians look at the popular vote, the Electoral College and how many seats the president’s party holds in Congress [2].
Sources
- ptrdo, Margins of US Presidential Elections, Combined to Describe “Mandate,” 1924-2024, r/dataisbeautiful, January 2025. The original post for the infographic.
- The American Presidency Project, Presidential Election Margin of Victory, eds. John T. Woolley and Gerhard Peters, updated 6 November 2024, and Seats in Congress gained or lost by the president’s party.
- Wikipedia, Party divisions of United States Congresses, seat counts at the start of each Congress, from House and Senate records.
- Wikipedia, 2024 United States presidential election, with the Federal Election Commission’s certified vote totals.
- Wikipedia, Split-ticket voting, section on the United States.
Last reviewed 13 November 2026