What was the federal budget in 2023?
In the federal budget 2023 (fiscal year 2023, October 2022 to September 2023) the US government spent $6.1 trillion and collected $4.4 trillion in revenue, according to the Congressional Budget Office. That left a deficit of $1.7 trillion, or 6.3% of GDP. Social Security was the biggest single cost at $1.3 trillion, and interest on the debt cost $659 billion.
The infographic by the Congressional Budget Office (CBO) sets out where that money went and where it came from, using the actual year end figures [1]. The exact Treasury totals were $6.134 trillion of outlays, $4.439 trillion of receipts and a deficit of $1.695 trillion [2]. This article explains those numbers, why the deficit grew in 2023, and why the real gap was bigger than the headline figure.
Federal spending in 2023
Most federal spending is mandatory, meaning it is set by law rather than voted on each year. Mandatory programmes took $3.8 trillion in 2023, discretionary spending $1.7 trillion and net interest $659 billion [1].
| Spending | 2023 outlays | % of GDP |
|---|---|---|
| Social Security | $1.3 trillion | 5.0% |
| Medicare | $839 billion | 3.1% |
| Medicaid | $616 billion | 2.3% |
| Income security programmes | $448 billion | 1.7% |
| Other mandatory spending | $502 billion | 1.9% |
| Total mandatory | $3.8 trillion | 13.9% |
| Nondefense discretionary | $917 billion | 3.4% |
| Defense | $805 billion | 3.0% |
| Total discretionary | $1.7 trillion | 6.4% |
| Net interest | $659 billion | 2.4% |
| Total outlays | $6.1 trillion | 22.7% |
Figures are from CBO [1]. The mandatory items add up to slightly less than the total because each is rounded.
Medicare is shown net of the premiums people pay, and other mandatory spending covers federal civilian and military pensions and some veterans’ benefits [1]. Nondefense discretionary spending pays for things such as veterans’ health care, education, transport and some health and income support programmes. Congress set the discretionary amounts for 2023 in the Consolidated Appropriations Act, which President Biden signed on 29 December 2022, three months into the fiscal year [3].
Where federal revenue came from in 2023
Individual income tax is the largest source of federal revenue, and it brought in $2.2 trillion in 2023, half of the total [1].
| Revenue source | 2023 revenue | % of GDP |
|---|---|---|
| Individual income taxes | $2.2 trillion | 8.1% |
| Payroll taxes | $1.6 trillion | 6.0% |
| Corporate income taxes | $420 billion | 1.6% |
| Other (customs duties, excise taxes, estate and gift taxes, fees, Federal Reserve remittances) | $229 billion | 0.8% |
| Total revenues | $4.4 trillion | 16.5% |
Payroll taxes mainly pay for Social Security and Medicare’s hospital insurance [1]. Revenue fell by about $455 billion (9%) compared with 2022. CBO puts that down mainly to lower income tax paid outside of payroll withholding and to much smaller payments from the Federal Reserve to the Treasury [4].
The 2023 deficit and the real gap
The 2023 deficit was $1.7 trillion, about $0.3 trillion more than in 2022, even though spending fell by $141 billion [4]. Revenue fell faster than spending.
The headline figure understates the gap. In 2022 the government recorded $379 billion of costs for President Biden’s student loan cancellation plan. After the Supreme Court struck the plan down in June 2023, it recorded a $333 billion saving in August 2023, which cut the 2023 deficit [4]. CBO says that without those student loan entries the 2023 deficit would have been $2.0 trillion, and the deficit would have grown by nearly $1.1 trillion from 2022 to 2023 [4].
At 6.3% of GDP the deficit was well above the 50 year average of 3.7% [1]. As the CBO graphic shows, deficits that size used to happen only in recessions or emergencies, such as 2009 and 2020, whereas 2023 was a year of low unemployment. The last surpluses were in fiscal years 1998 to 2001.
Debt and interest costs
Federal debt held by the public reached 97% of GDP at the end of 2023, roughly double the 1974 to 2023 average of 48.3% [1]. Debt held by the public is what the government has borrowed from investors, including the Federal Reserve and foreign governments, to cover past deficits.
Interest is the fastest growing part of the budget. Net interest costs rose 87% between 2021 and 2023, to $659 billion, because the debt kept growing and interest rates went up from close to zero [1]. In 2023 the government spent more on net interest than on Medicaid, and not far short of what it spent on defense.
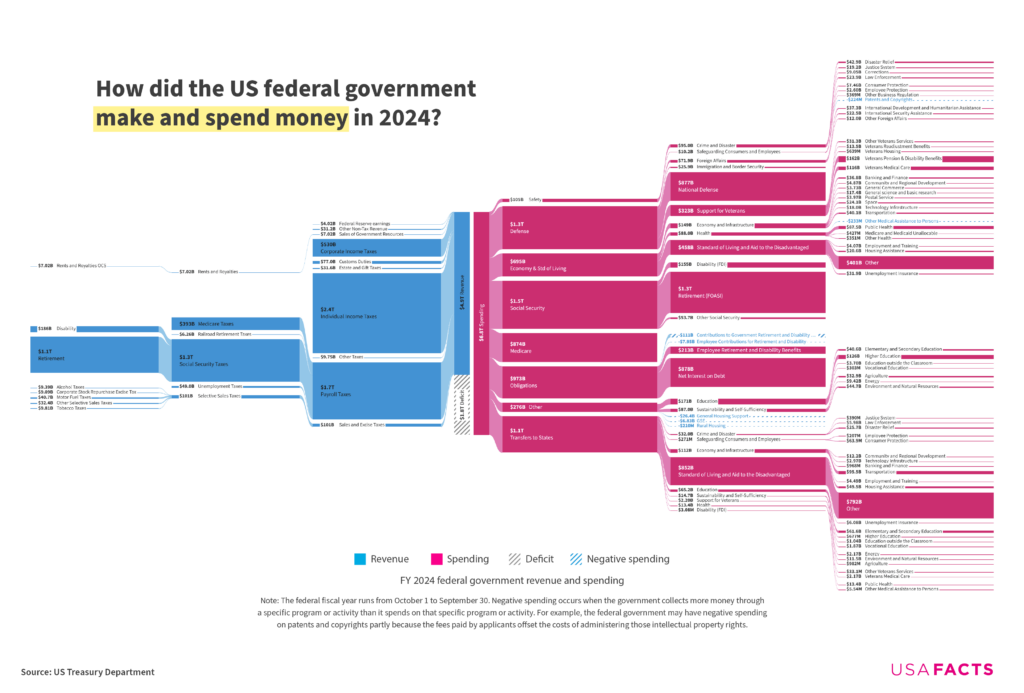
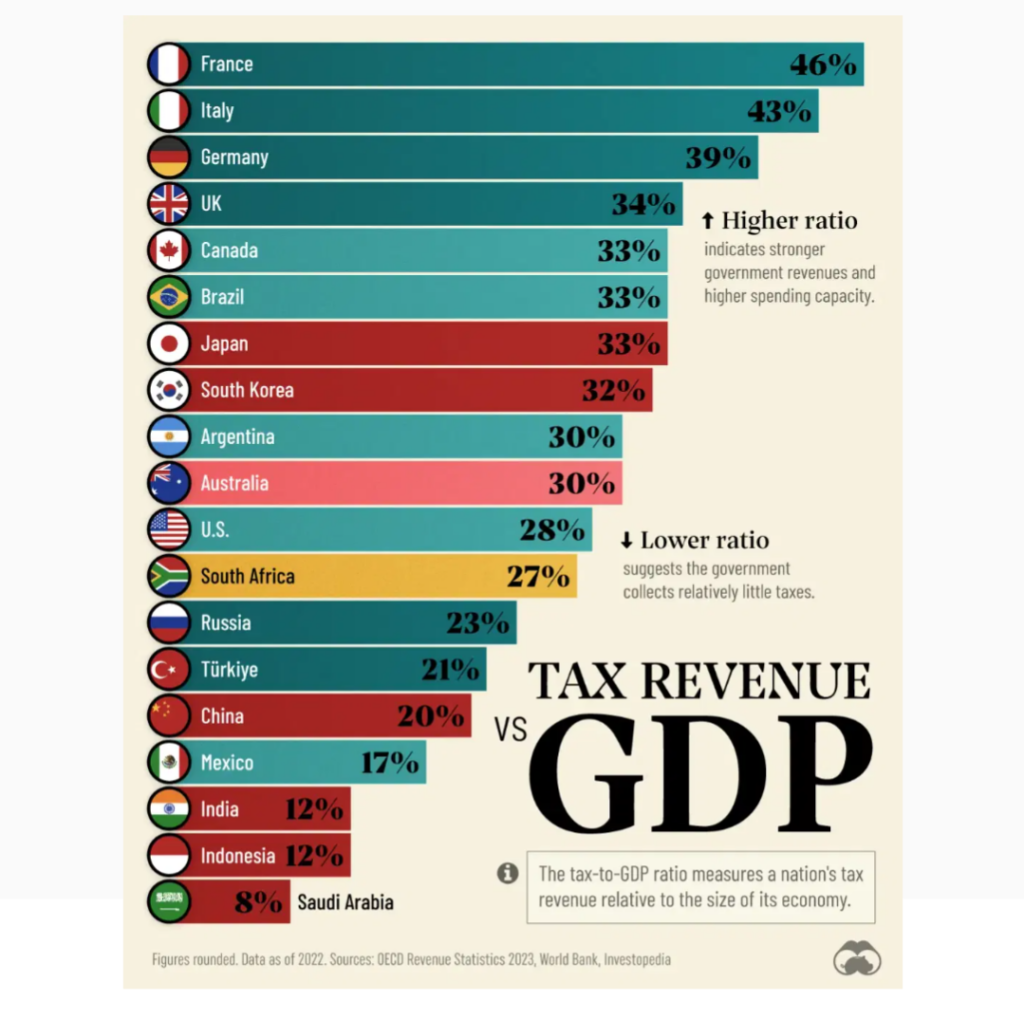
For the following year, our page on US tax revenue and federal spending in 2024 covers fiscal year 2024, and tax to GDP ratios by country shows how US tax levels compare with other major economies.
How the federal budget process works
The President sends a budget request to Congress, usually in February, but it is only a proposal. Congress decides discretionary spending through 12 annual appropriations bills, which are often rolled together into one large bill, as happened for 2023 [3]. Mandatory programmes such as Social Security and Medicare run automatically under existing law, so about 60% of spending is not voted on in a normal year [1].
That is why the actual figures for a fiscal year, as in the CBO infographic, can differ quite a lot from what the President requested. The President’s 2023 budget request is a forecast. The figures above are what was actually spent and collected.
Questions about the federal budget 2023
What are the three biggest expenses in the federal budget?
In 2023 they were Social Security ($1.3 trillion), Medicare ($839 billion) and defense ($805 billion), followed by net interest ($659 billion) and Medicaid ($616 billion) [1].
How much did the US spend on defense in 2023?
$805 billion of discretionary outlays, or 3.0% of GDP [1]. That was 13% of all federal spending (our arithmetic).
Was the 2023 federal budget balanced?
No. Spending was $1.7 trillion more than revenue, and the government borrowed to cover the gap [1].
Who was the last president to balance the budget?
Bill Clinton. The government ran surpluses in fiscal years 1998 to 2001, the last of which began under Clinton and ended under George W. Bush [1].
How much interest did the US pay on its debt in 2023?
$659 billion in net interest, 2.4% of GDP, up 87% from 2021 [1].
Sources
- Congressional Budget Office, The Federal Budget in Fiscal Year 2023, An Infographic, 5 March 2024, using the actual amounts in The Accuracy of CBO’s Budget Projections for Fiscal Year 2023. The original page for the infographic.
- Wikipedia, 2023 United States federal budget, with Treasury’s final fiscal year 2023 totals.
- Congress.gov, H.R. 2617, Consolidated Appropriations Act, 2023, signed 29 December 2022.
- Congressional Budget Office, Monthly Budget Review, September 2023, 10 October 2023.
Last reviewed 13 November 2026