


Taxes and Public Spending
Tax to GDP Ratio by Country
Across the 38 OECD countries it averaged 34.1% in 2024, the highest level on record, according to OECD Revenue Statistics 2025.
This section covers how governments raise and spend money, including income tax rates, tax as a share of the economy, national budgets and who pays into the EU budget. Each page writes out the figures from the graphic and checks them against Tax Foundation, OECD, Congressional Budget Office or EU budget data. Start with top personal income tax rates in Europe, EU contributors and beneficiaries, US tax revenue and federal spending, the federal budget in one infographic or the UK tax burden compared with the OECD.
Across the 38 OECD countries it averaged 34.1% in 2024, the highest level on record, according to OECD Revenue Statistics 2025.

That is what the federal government collected in fiscal year 2024 (October 2023 to September 2024), according to the Treasury's Monthly Treasury Statement.
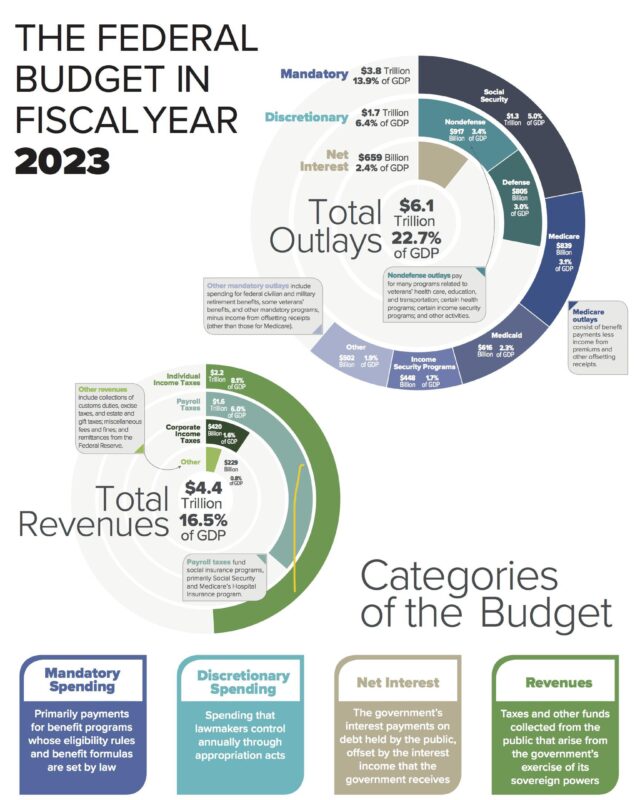
That left a deficit of $1.7 trillion, or 6.3% of GDP.
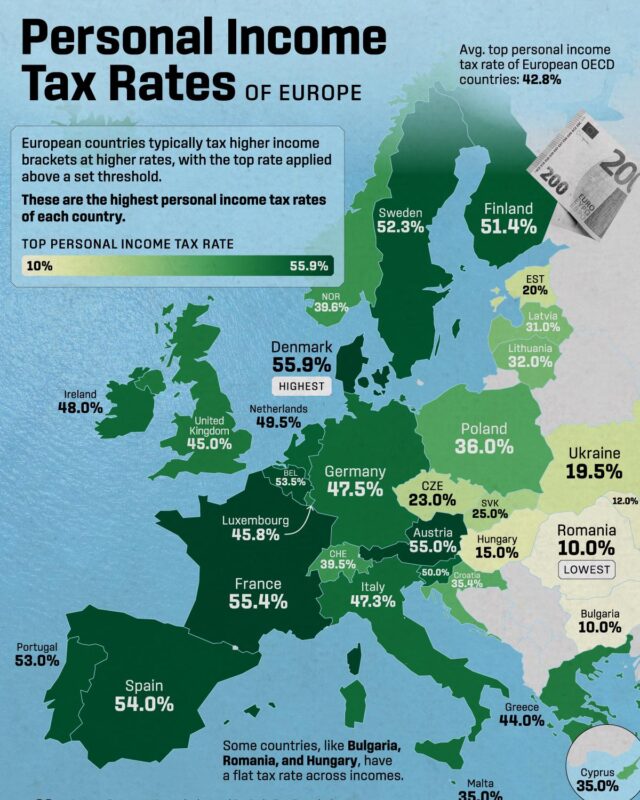
Denmark has the highest top rate of income tax at 60.5% in 2026, Belgium takes the most from an average worker's pay at 50.8%, and Hungary charges the…

In 2025 ten countries were net contributors, led by Germany at about 21.8 billion euros, while Romania, Poland and Belgium were the largest net beneficiaries.
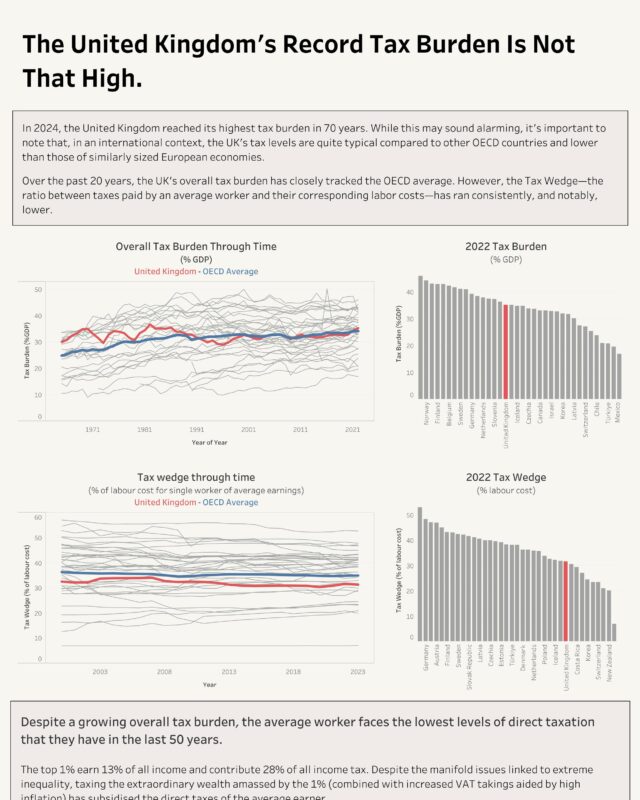
By the UK's own history it is high and rising: the OBR puts the tax take at 36.0% of GDP in 2025-26 and expects it to pass its historical high of 37.2% in…
Give it a permanent page where people looking for your subject find it, with your name and a link to your site. Content marketers, agencies, designers and researchers all list here.